Immigrants from Nicaragua vs Immigrants from Lithuania Male Unemployment

COMPARE

Immigrants from Nicaragua
Race
Ancestry
AfghanAfricanAlaska NativeAlaskan AthabascanAlbanianAleutAlsatianAmericanApacheArabArapahoArgentineanArmenianAssyrian/Chaldean/SyriacAustralianAustrianBahamianBangladeshiBarbadianBasqueBelgianBelizeanBermudanBhutaneseBlackfeetBolivianBrazilianBritishBritish West IndianBulgarianBurmeseCajunCambodianCanadianCape VerdeanCarpatho RusynCelticCentral AmericanCentral American IndianCherokeeCheyenneChickasawChileanChineseChippewaChoctawColombianColvilleComancheCosta RicanCreeCreekCroatianCrowCubanCypriotCzechCzechoslovakianDanishDelawareDominicanDutchDutch West IndianEastern EuropeanEcuadorianEgyptianEnglishEstonianEthiopianEuropeanFijianFilipinoFinnishFrenchFrench American IndianFrench CanadianGermanGerman RussianGhanaianGreekGuamanian/ChamorroGuatemalanGuyaneseHaitianHmongHonduranHopiHoumaHungarianIcelanderIndian (Asian)IndonesianInupiatIranianIraqiIrishIroquoisIsraeliItalianJamaicanJapaneseJordanianKenyanKiowaKoreanLaotianLatvianLebaneseLiberianLithuanianLumbeeLuxembourgerMacedonianMalaysianMalteseMarshalleseMenomineeMexicanMexican American IndianMongolianMoroccanNative HawaiianNavajoNepaleseNew ZealanderNicaraguanNigerianNorthern EuropeanNorwegianOkinawanOsageOttawaPaiutePakistaniPalestinianPanamanianParaguayanPennsylvania GermanPeruvianPimaPolishPortuguesePotawatomiPuebloPuerto RicanPuget Sound SalishRomanianRussianSalvadoranSamoanScandinavianScotch-IrishScottishSeminoleSenegaleseSerbianShoshoneSierra LeoneanSiouxSlavicSlovakSloveneSomaliSouth AfricanSouth AmericanSouth American IndianSoviet UnionSpaniardSpanishSpanish AmericanSpanish American IndianSri LankanSubsaharan AfricanSudaneseSwedishSwissSyrianTaiwaneseThaiTlingit-HaidaTohono O'OdhamTonganTrinidadian and TobagonianTsimshianTurkishU.S. Virgin IslanderUgandanUkrainianUruguayanUteVenezuelanVietnameseWelshWest IndianYakamaYaquiYugoslavianYumanYup'ikZimbabwean
Immigration
NonimmigrantsImmigrantsAfghanistanAfricaAlbaniaArgentinaArmeniaAsiaAustraliaAustriaBahamasBangladeshBarbadosBelarusBelgiumBelizeBoliviaBosnia and HerzegovinaBrazilBulgariaBurma/MyanmarCabo VerdeCambodiaCameroonCanadaCaribbeanCentral AmericaChileChinaColombiaCongoCosta RicaCroatiaCubaCzechoslovakiaDenmarkDominicaDominican RepublicEastern AfricaEastern AsiaEastern EuropeEcuadorEgyptEl SalvadorEnglandEritreaEthiopiaEuropeFijiFranceGermanyGhanaGreeceGrenadaGuatemalaGuyanaHaitiHondurasHong KongHungaryIndiaIndonesiaIranIraqIrelandIsraelItalyJamaicaJapanJordanKazakhstanKenyaKoreaKuwaitLaosLatin AmericaLatviaLebanonLiberiaMalaysiaMexicoMicronesiaMiddle AfricaMoldovaMoroccoNepalNetherlandsNicaraguaNigeriaNorth AmericaNorth MacedoniaNorthern AfricaNorthern EuropeNorwayOceaniaPakistanPanamaPeruPhilippinesPolandPortugalRomaniaRussiaSaudi ArabiaScotlandSenegalSerbiaSierra LeoneSingaporeSomaliaSouth AfricaSouth AmericaSouth Central AsiaSouth Eastern AsiaSouthern EuropeSpainSri LankaSt. Vincent and the GrenadinesSudanSwedenSwitzerlandSyriaTaiwanThailandTrinidad and TobagoTurkeyUgandaUkraineUruguayUzbekistanVenezuelaVietnamWest IndiesWestern AfricaWestern AsiaWestern EuropeYemenZaireZimbabweAzores
Immigrants from Lithuania
Race
Ancestry
AfghanAfricanAlaska NativeAlaskan AthabascanAlbanianAleutAlsatianAmericanApacheArabArapahoArgentineanArmenianAssyrian/Chaldean/SyriacAustralianAustrianBahamianBangladeshiBarbadianBasqueBelgianBelizeanBermudanBhutaneseBlackfeetBolivianBrazilianBritishBritish West IndianBulgarianBurmeseCajunCambodianCanadianCape VerdeanCarpatho RusynCelticCentral AmericanCentral American IndianCherokeeCheyenneChickasawChileanChineseChippewaChoctawColombianColvilleComancheCosta RicanCreeCreekCroatianCrowCubanCypriotCzechCzechoslovakianDanishDelawareDominicanDutchDutch West IndianEastern EuropeanEcuadorianEgyptianEnglishEstonianEthiopianEuropeanFijianFilipinoFinnishFrenchFrench American IndianFrench CanadianGermanGerman RussianGhanaianGreekGuamanian/ChamorroGuatemalanGuyaneseHaitianHmongHonduranHopiHoumaHungarianIcelanderIndian (Asian)IndonesianInupiatIranianIraqiIrishIroquoisIsraeliItalianJamaicanJapaneseJordanianKenyanKiowaKoreanLaotianLatvianLebaneseLiberianLithuanianLumbeeLuxembourgerMacedonianMalaysianMalteseMarshalleseMenomineeMexicanMexican American IndianMongolianMoroccanNative HawaiianNavajoNepaleseNew ZealanderNicaraguanNigerianNorthern EuropeanNorwegianOkinawanOsageOttawaPaiutePakistaniPalestinianPanamanianParaguayanPennsylvania GermanPeruvianPimaPolishPortuguesePotawatomiPuebloPuerto RicanPuget Sound SalishRomanianRussianSalvadoranSamoanScandinavianScotch-IrishScottishSeminoleSenegaleseSerbianShoshoneSierra LeoneanSiouxSlavicSlovakSloveneSomaliSouth AfricanSouth AmericanSouth American IndianSoviet UnionSpaniardSpanishSpanish AmericanSpanish American IndianSri LankanSubsaharan AfricanSudaneseSwedishSwissSyrianTaiwaneseThaiTlingit-HaidaTohono O'OdhamTonganTrinidadian and TobagonianTsimshianTurkishU.S. Virgin IslanderUgandanUkrainianUruguayanUteVenezuelanVietnameseWelshWest IndianYakamaYaquiYugoslavianYumanYup'ikZimbabwean
Immigration
NonimmigrantsImmigrantsAfghanistanAfricaAlbaniaArgentinaArmeniaAsiaAustraliaAustriaBahamasBangladeshBarbadosBelarusBelgiumBelizeBoliviaBosnia and HerzegovinaBrazilBulgariaBurma/MyanmarCabo VerdeCambodiaCameroonCanadaCaribbeanCentral AmericaChileChinaColombiaCongoCosta RicaCroatiaCubaCzechoslovakiaDenmarkDominicaDominican RepublicEastern AfricaEastern AsiaEastern EuropeEcuadorEgyptEl SalvadorEnglandEritreaEthiopiaEuropeFijiFranceGermanyGhanaGreeceGrenadaGuatemalaGuyanaHaitiHondurasHong KongHungaryIndiaIndonesiaIranIraqIrelandIsraelItalyJamaicaJapanJordanKazakhstanKenyaKoreaKuwaitLaosLatin AmericaLatviaLebanonLiberiaLithuaniaMalaysiaMexicoMicronesiaMiddle AfricaMoldovaMoroccoNepalNetherlandsNigeriaNorth AmericaNorth MacedoniaNorthern AfricaNorthern EuropeNorwayOceaniaPakistanPanamaPeruPhilippinesPolandPortugalRomaniaRussiaSaudi ArabiaScotlandSenegalSerbiaSierra LeoneSingaporeSomaliaSouth AfricaSouth AmericaSouth Central AsiaSouth Eastern AsiaSouthern EuropeSpainSri LankaSt. Vincent and the GrenadinesSudanSwedenSwitzerlandSyriaTaiwanThailandTrinidad and TobagoTurkeyUgandaUkraineUruguayUzbekistanVenezuelaVietnamWest IndiesWestern AfricaWestern AsiaWestern EuropeYemenZaireZimbabweAzores
Male Unemployment
Income
Poverty
Unemployment
Labor Participation
Family Structure
Vehicle Availability
Education Level
Disability

Male Unemployment Comparison

Immigrants from Nicaragua

Immigrants from Lithuania

Exceptional
Excellent
5.1%
MALE UNEMPLOYMENT
91.2/ 100
METRIC RATING
108th/ 347
METRIC RANK
5.1%
MALE UNEMPLOYMENT
87.2/ 100
METRIC RATING
125th/ 347
METRIC RANK

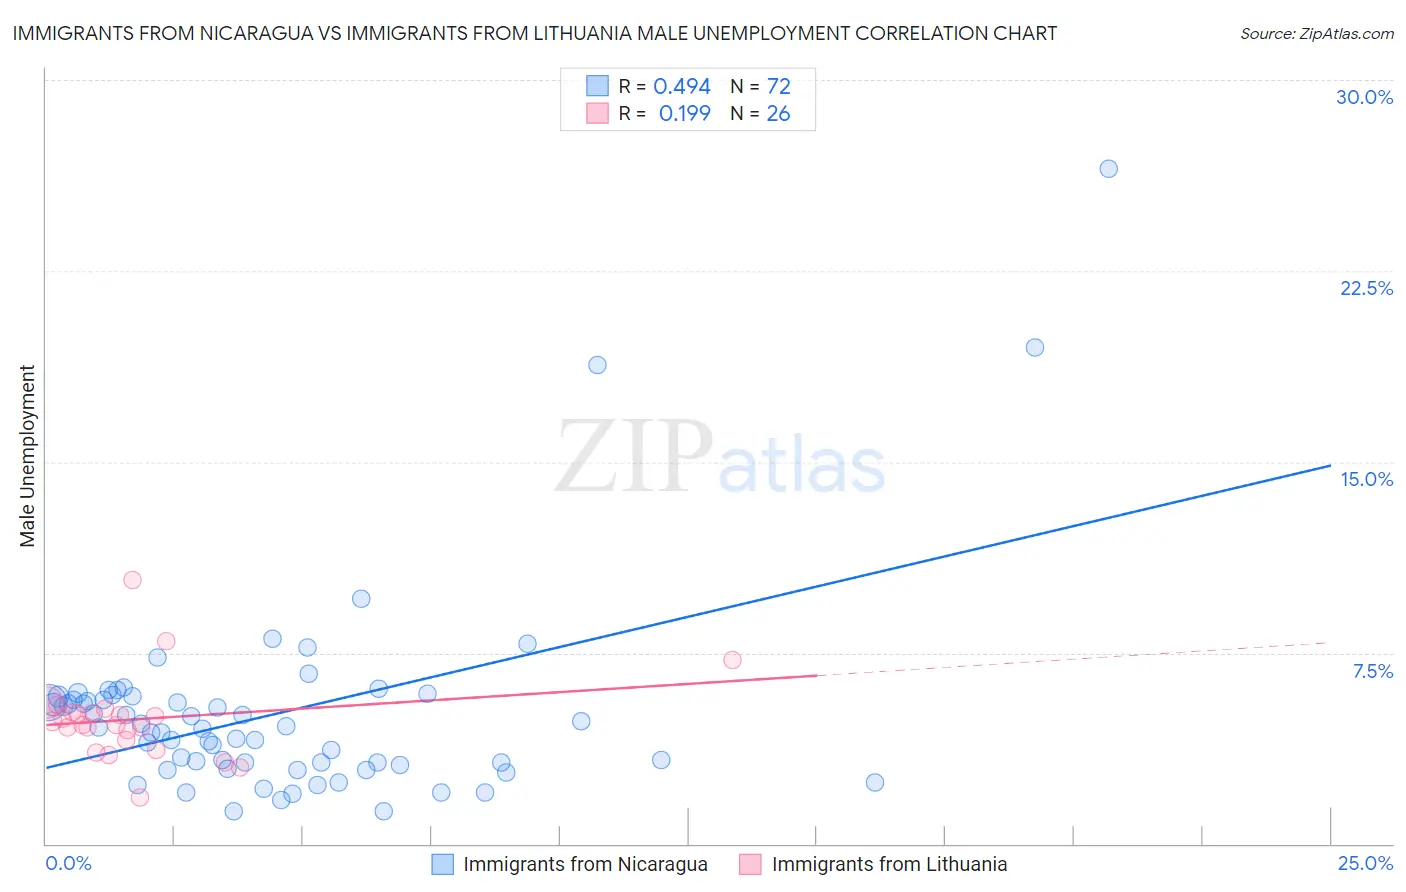
Immigrants from Nicaragua vs Immigrants from Lithuania Male Unemployment Correlation Chart

The statistical analysis conducted on geographies consisting of 236,032,179 people shows a moderate positive correlation between the proportion of Immigrants from Nicaragua and unemployment rate among males in the United States with a correlation coefficient (R) of 0.494 and weighted average of 5.1%. Similarly, the statistical analysis conducted on geographies consisting of 117,611,759 people shows a poor positive correlation between the proportion of Immigrants from Lithuania and unemployment rate among males in the United States with a correlation coefficient (R) of 0.199 and weighted average of 5.1%, a difference of 0.64%.
Immigrants from Nicaragua vs Immigrants from Lithuania Male Unemployment

Male Unemployment Correlation Summary

MeasurementImmigrants from NicaraguaImmigrants from Lithuania
Minimum1.3%1.8%
Maximum26.5%10.4%
Range25.2%8.5%
Mean5.1%4.9%
Median4.5%4.7%
Interquartile 25% (IQ1)3.2%4.1%
Interquartile 75% (IQ3)5.7%5.1%
Interquartile Range (IQR)2.6%1.1%
Standard Deviation (Sample)3.9%1.6%
Standard Deviation (Population)3.9%1.6%

Demographics Similar to Immigrants from Nicaragua and Immigrants from Lithuania by Male Unemployment

In terms of male unemployment, the demographic groups most similar to Immigrants from Nicaragua are Ethiopian (5.1%, a difference of 0.010%), Immigrants from Ethiopia (5.1%, a difference of 0.050%), Immigrants from Pakistan (5.1%, a difference of 0.060%), Immigrants from England (5.1%, a difference of 0.080%), and Immigrants from Eastern Asia (5.1%, a difference of 0.090%). Similarly, the demographic groups most similar to Immigrants from Lithuania are Immigrants from Latvia (5.1%, a difference of 0.040%), Immigrants from Colombia (5.1%, a difference of 0.060%), Palestinian (5.1%, a difference of 0.070%), Nicaraguan (5.1%, a difference of 0.14%), and Ukrainian (5.1%, a difference of 0.17%).
DemographicsRating | RankMale Unemployment
Immigrants | Ethiopia
91.5
/100
|
#106
Exceptional
5.1%
Ethiopians
91.3
/100
|
#107
Exceptional
5.1%
Immigrants | Nicaragua
91.2
/100
|
#108
Exceptional
5.1%
Immigrants | Pakistan
90.9
/100
|
#109
Exceptional
5.1%
Immigrants | England
90.8
/100
|
#110
Exceptional
5.1%
Immigrants | Eastern Asia
90.8
/100
|
#111
Exceptional
5.1%
Immigrants | Moldova
90.3
/100
|
#112
Exceptional
5.1%
Immigrants | Austria
90.3
/100
|
#113
Exceptional
5.1%
Romanians
89.8
/100
|
#114
Excellent
5.1%
Immigrants | Asia
89.6
/100
|
#115
Excellent
5.1%
Immigrants | Denmark
89.4
/100
|
#116
Excellent
5.1%
Estonians
89.0
/100
|
#117
Excellent
5.1%
Cypriots
88.8
/100
|
#118
Excellent
5.1%
French Canadians
88.6
/100
|
#119
Excellent
5.1%
Ukrainians
88.4
/100
|
#120
Excellent
5.1%
Mongolians
88.4
/100
|
#121
Excellent
5.1%
Nicaraguans
88.2
/100
|
#122
Excellent
5.1%
Palestinians
87.7
/100
|
#123
Excellent
5.1%
Immigrants | Latvia
87.5
/100
|
#124
Excellent
5.1%
Immigrants | Lithuania
87.2
/100
|
#125
Excellent
5.1%
Immigrants | Colombia
86.8
/100
|
#126
Excellent
5.1%