Immigrants from Morocco vs Swiss Male Unemployment
COMPARE
Immigrants from Morocco
Swiss
Male Unemployment
Male Unemployment Comparison
Immigrants from Morocco
Swiss
5.3%
MALE UNEMPLOYMENT
60.2/ 100
METRIC RATING
166th/ 347
METRIC RANK
4.7%
MALE UNEMPLOYMENT
99.9/ 100
METRIC RATING
16th/ 347
METRIC RANK
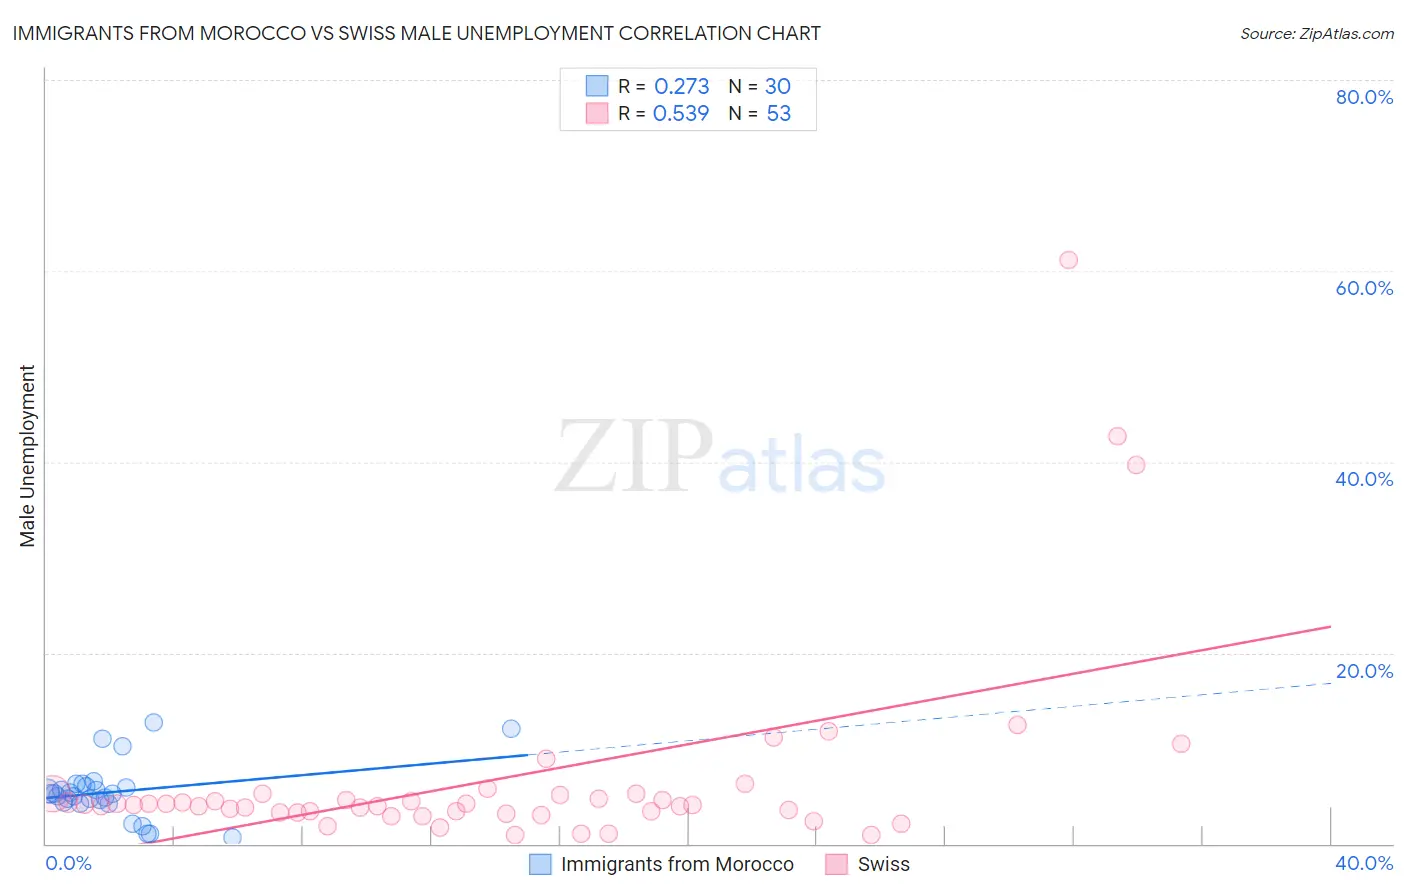
Immigrants from Morocco vs Swiss Male Unemployment Correlation Chart
The statistical analysis conducted on geographies consisting of 178,783,560 people shows a weak positive correlation between the proportion of Immigrants from Morocco and unemployment rate among males in the United States with a correlation coefficient (R) of 0.273 and weighted average of 5.3%. Similarly, the statistical analysis conducted on geographies consisting of 460,477,657 people shows a substantial positive correlation between the proportion of Swiss and unemployment rate among males in the United States with a correlation coefficient (R) of 0.539 and weighted average of 4.7%, a difference of 11.8%.
Male Unemployment Correlation Summary
| Measurement | Immigrants from Morocco | Swiss |
| Minimum | 0.60% | 0.90% |
| Maximum | 12.7% | 61.1% |
| Range | 12.1% | 60.2% |
| Mean | 5.4% | 6.9% |
| Median | 5.2% | 4.1% |
| Interquartile 25% (IQ1) | 4.4% | 3.3% |
| Interquartile 75% (IQ3) | 6.0% | 5.2% |
| Interquartile Range (IQR) | 1.6% | 1.8% |
| Standard Deviation (Sample) | 2.9% | 10.7% |
| Standard Deviation (Population) | 2.9% | 10.6% |
Similar Demographics by Male Unemployment
Demographics Similar to Immigrants from Morocco by Male Unemployment
In terms of male unemployment, the demographic groups most similar to Immigrants from Morocco are South American (5.3%, a difference of 0.030%), Afghan (5.3%, a difference of 0.11%), Immigrants from Vietnam (5.3%, a difference of 0.12%), Immigrants from Ireland (5.3%, a difference of 0.15%), and Immigrants from Congo (5.3%, a difference of 0.17%).
| Demographics | Rating | Rank | Male Unemployment |
| Indonesians | 71.2 /100 | #159 | Good 5.2% |
| Immigrants | Norway | 71.0 /100 | #160 | Good 5.2% |
| Immigrants | China | 70.6 /100 | #161 | Good 5.2% |
| Immigrants | Egypt | 65.9 /100 | #162 | Good 5.2% |
| Immigrants | Hong Kong | 65.7 /100 | #163 | Good 5.2% |
| Afghans | 62.0 /100 | #164 | Good 5.3% |
| South Americans | 60.6 /100 | #165 | Good 5.3% |
| Immigrants | Morocco | 60.2 /100 | #166 | Good 5.3% |
| Immigrants | Vietnam | 58.1 /100 | #167 | Average 5.3% |
| Immigrants | Ireland | 57.7 /100 | #168 | Average 5.3% |
| Immigrants | Congo | 57.4 /100 | #169 | Average 5.3% |
| Immigrants | Eastern Europe | 54.1 /100 | #170 | Average 5.3% |
| Peruvians | 51.9 /100 | #171 | Average 5.3% |
| Immigrants | Kazakhstan | 50.8 /100 | #172 | Average 5.3% |
| Immigrants | Russia | 50.7 /100 | #173 | Average 5.3% |
Demographics Similar to Swiss by Male Unemployment
In terms of male unemployment, the demographic groups most similar to Swiss are Scandinavian (4.7%, a difference of 0.050%), German (4.7%, a difference of 0.32%), Bolivian (4.7%, a difference of 0.34%), Filipino (4.7%, a difference of 0.73%), and Immigrants from Bolivia (4.7%, a difference of 1.0%).
| Demographics | Rating | Rank | Male Unemployment |
| Thais | 100.0 /100 | #9 | Exceptional 4.6% |
| Cubans | 100.0 /100 | #10 | Exceptional 4.6% |
| Swedes | 100.0 /100 | #11 | Exceptional 4.6% |
| Immigrants | Bolivia | 100.0 /100 | #12 | Exceptional 4.7% |
| Bolivians | 100.0 /100 | #13 | Exceptional 4.7% |
| Germans | 100.0 /100 | #14 | Exceptional 4.7% |
| Scandinavians | 100.0 /100 | #15 | Exceptional 4.7% |
| Swiss | 99.9 /100 | #16 | Exceptional 4.7% |
| Filipinos | 99.9 /100 | #17 | Exceptional 4.7% |
| English | 99.9 /100 | #18 | Exceptional 4.8% |
| Europeans | 99.9 /100 | #19 | Exceptional 4.8% |
| Pennsylvania Germans | 99.9 /100 | #20 | Exceptional 4.8% |
| Immigrants | Taiwan | 99.9 /100 | #21 | Exceptional 4.8% |
| Carpatho Rusyns | 99.9 /100 | #22 | Exceptional 4.8% |
| Tongans | 99.9 /100 | #23 | Exceptional 4.8% |