Immigrants from Mexico vs Palestinian Unemployment Among Ages 25 to 29 years
COMPARE
Immigrants from Mexico
Palestinian
Unemployment Among Ages 25 to 29 years
Unemployment Among Ages 25 to 29 years Comparison
Immigrants from Mexico
Palestinians
7.6%
UNEMPLOYMENT AMONG AGES 25 TO 29 YEARS
0.0/ 100
METRIC RATING
287th/ 347
METRIC RANK
6.3%
UNEMPLOYMENT AMONG AGES 25 TO 29 YEARS
97.7/ 100
METRIC RATING
68th/ 347
METRIC RANK
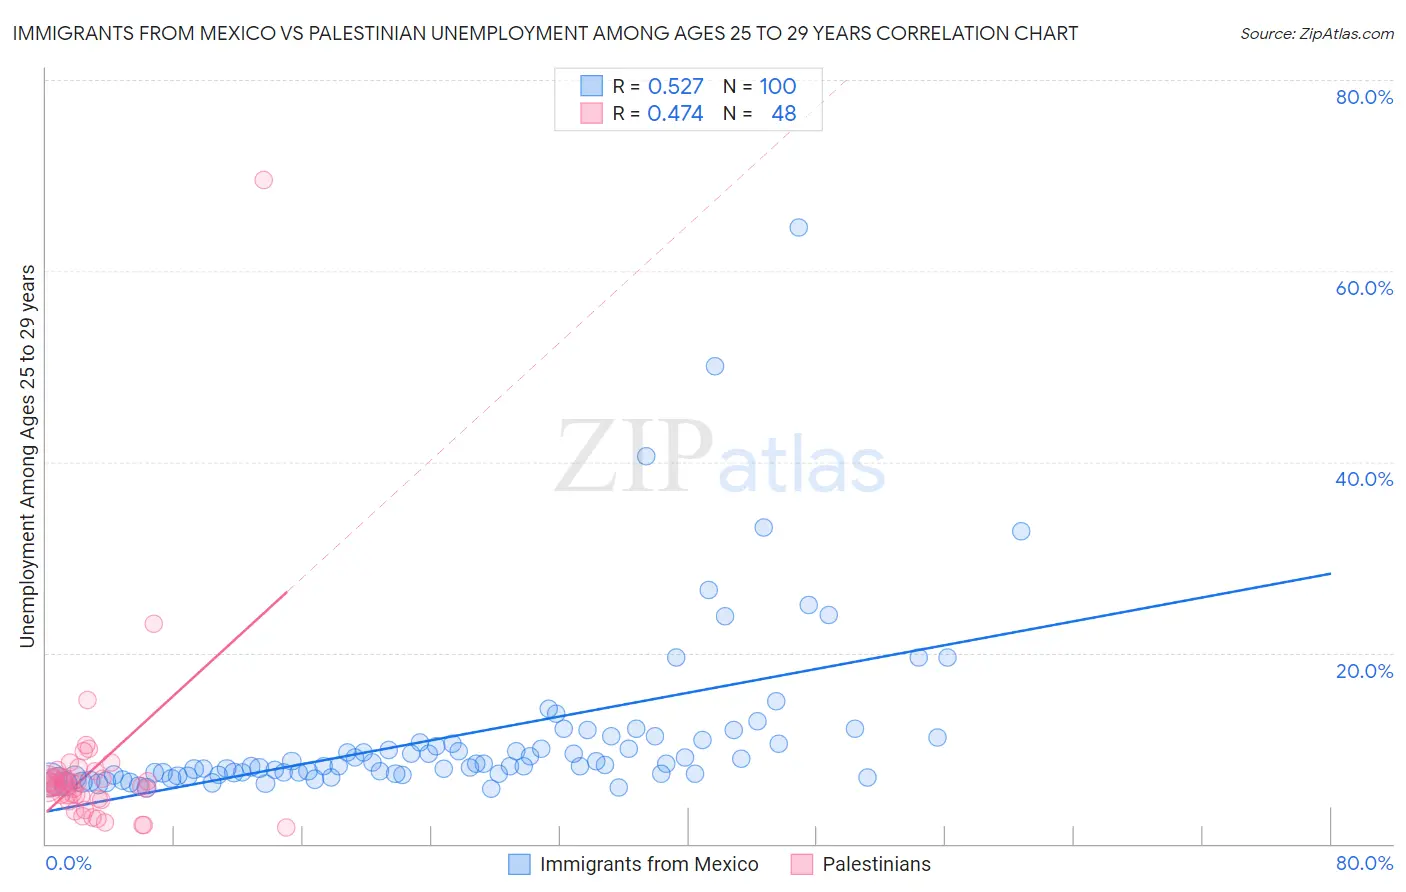
Immigrants from Mexico vs Palestinian Unemployment Among Ages 25 to 29 years Correlation Chart
The statistical analysis conducted on geographies consisting of 471,781,188 people shows a substantial positive correlation between the proportion of Immigrants from Mexico and unemployment rate among population between the ages 25 and 29 in the United States with a correlation coefficient (R) of 0.527 and weighted average of 7.6%. Similarly, the statistical analysis conducted on geographies consisting of 211,975,975 people shows a moderate positive correlation between the proportion of Palestinians and unemployment rate among population between the ages 25 and 29 in the United States with a correlation coefficient (R) of 0.474 and weighted average of 6.3%, a difference of 21.9%.
Unemployment Among Ages 25 to 29 years Correlation Summary
| Measurement | Immigrants from Mexico | Palestinian |
| Minimum | 5.8% | 1.7% |
| Maximum | 64.6% | 69.5% |
| Range | 58.8% | 67.8% |
| Mean | 11.3% | 7.7% |
| Median | 8.2% | 6.2% |
| Interquartile 25% (IQ1) | 7.3% | 4.9% |
| Interquartile 75% (IQ3) | 10.7% | 7.0% |
| Interquartile Range (IQR) | 3.5% | 2.2% |
| Standard Deviation (Sample) | 9.0% | 9.7% |
| Standard Deviation (Population) | 9.0% | 9.6% |
Similar Demographics by Unemployment Among Ages 25 to 29 years
Demographics Similar to Immigrants from Mexico by Unemployment Among Ages 25 to 29 years
In terms of unemployment among ages 25 to 29 years, the demographic groups most similar to Immigrants from Mexico are African (7.6%, a difference of 0.060%), Vietnamese (7.6%, a difference of 0.59%), Senegalese (7.6%, a difference of 0.68%), Belizean (7.7%, a difference of 0.77%), and Cherokee (7.6%, a difference of 0.80%).
| Demographics | Rating | Rank | Unemployment Among Ages 25 to 29 years |
| Immigrants | Caribbean | 0.0 /100 | #280 | Tragic 7.5% |
| Immigrants | Bangladesh | 0.0 /100 | #281 | Tragic 7.5% |
| Immigrants | Senegal | 0.0 /100 | #282 | Tragic 7.6% |
| Creek | 0.0 /100 | #283 | Tragic 7.6% |
| Cherokee | 0.0 /100 | #284 | Tragic 7.6% |
| Senegalese | 0.0 /100 | #285 | Tragic 7.6% |
| Vietnamese | 0.0 /100 | #286 | Tragic 7.6% |
| Immigrants | Mexico | 0.0 /100 | #287 | Tragic 7.6% |
| Africans | 0.0 /100 | #288 | Tragic 7.6% |
| Belizeans | 0.0 /100 | #289 | Tragic 7.7% |
| Armenians | 0.0 /100 | #290 | Tragic 7.7% |
| Hispanics or Latinos | 0.0 /100 | #291 | Tragic 7.7% |
| Chippewa | 0.0 /100 | #292 | Tragic 7.8% |
| Immigrants | Belize | 0.0 /100 | #293 | Tragic 7.8% |
| Trinidadians and Tobagonians | 0.0 /100 | #294 | Tragic 7.8% |
Demographics Similar to Palestinians by Unemployment Among Ages 25 to 29 years
In terms of unemployment among ages 25 to 29 years, the demographic groups most similar to Palestinians are Indian (Asian) (6.3%, a difference of 0.050%), Immigrants from Northern Africa (6.3%, a difference of 0.050%), Immigrants from Lebanon (6.3%, a difference of 0.070%), Immigrants from Sri Lanka (6.3%, a difference of 0.13%), and Kenyan (6.3%, a difference of 0.18%).
| Demographics | Rating | Rank | Unemployment Among Ages 25 to 29 years |
| Bhutanese | 98.2 /100 | #61 | Exceptional 6.2% |
| Immigrants | China | 98.1 /100 | #62 | Exceptional 6.2% |
| Kenyans | 98.0 /100 | #63 | Exceptional 6.3% |
| Immigrants | Sri Lanka | 97.9 /100 | #64 | Exceptional 6.3% |
| Immigrants | Lebanon | 97.8 /100 | #65 | Exceptional 6.3% |
| Indians (Asian) | 97.8 /100 | #66 | Exceptional 6.3% |
| Immigrants | Northern Africa | 97.8 /100 | #67 | Exceptional 6.3% |
| Palestinians | 97.7 /100 | #68 | Exceptional 6.3% |
| Immigrants | Hong Kong | 97.5 /100 | #69 | Exceptional 6.3% |
| Immigrants | Malaysia | 97.5 /100 | #70 | Exceptional 6.3% |
| Immigrants | France | 97.4 /100 | #71 | Exceptional 6.3% |
| Scandinavians | 97.4 /100 | #72 | Exceptional 6.3% |
| Belgians | 97.0 /100 | #73 | Exceptional 6.3% |
| Carpatho Rusyns | 96.9 /100 | #74 | Exceptional 6.3% |
| Immigrants | Jordan | 96.8 /100 | #75 | Exceptional 6.3% |