Immigrants from Lithuania vs Immigrants from Venezuela Unemployment Among Women with Children Under 6 years
COMPARE
Immigrants from Lithuania
Immigrants from Venezuela
Unemployment Among Women with Children Under 6 years
Unemployment Among Women with Children Under 6 years Comparison
Immigrants from Lithuania
Immigrants from Venezuela
7.5%
UNEMPLOYMENT AMONG WOMEN WITH CHILDREN UNDER 6 YEARS
68.8/ 100
METRIC RATING
162nd/ 347
METRIC RANK
7.1%
UNEMPLOYMENT AMONG WOMEN WITH CHILDREN UNDER 6 YEARS
98.8/ 100
METRIC RATING
81st/ 347
METRIC RANK
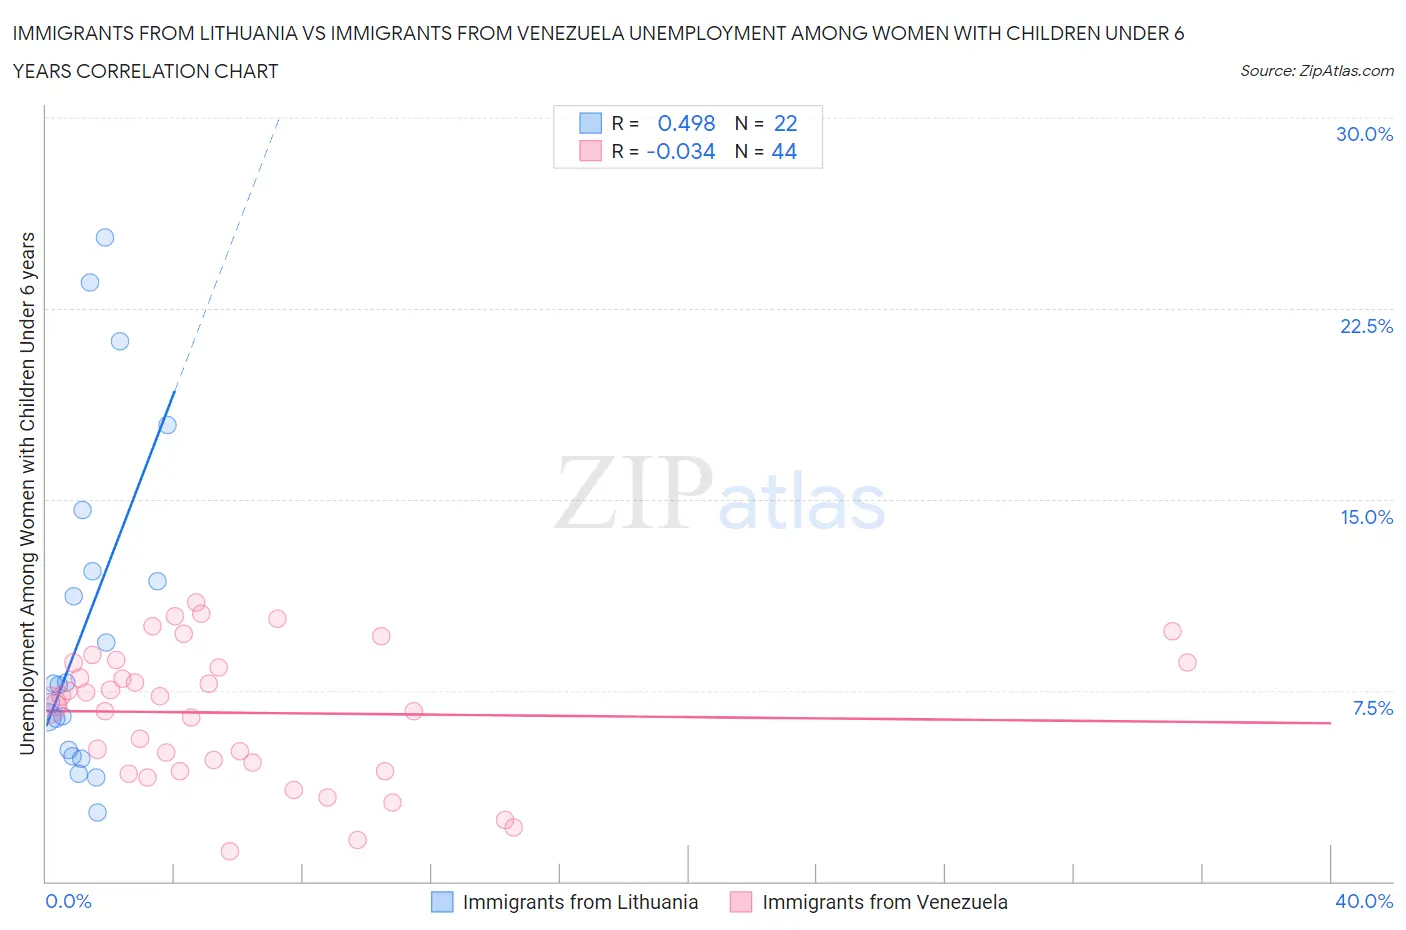
Immigrants from Lithuania vs Immigrants from Venezuela Unemployment Among Women with Children Under 6 years Correlation Chart
The statistical analysis conducted on geographies consisting of 102,015,606 people shows a moderate positive correlation between the proportion of Immigrants from Lithuania and unemployment rate among women with children under the age of 6 in the United States with a correlation coefficient (R) of 0.498 and weighted average of 7.5%. Similarly, the statistical analysis conducted on geographies consisting of 233,969,116 people shows no correlation between the proportion of Immigrants from Venezuela and unemployment rate among women with children under the age of 6 in the United States with a correlation coefficient (R) of -0.034 and weighted average of 7.1%, a difference of 6.5%.
Unemployment Among Women with Children Under 6 years Correlation Summary
| Measurement | Immigrants from Lithuania | Immigrants from Venezuela |
| Minimum | 2.7% | 1.2% |
| Maximum | 25.3% | 11.0% |
| Range | 22.6% | 9.8% |
| Mean | 10.1% | 6.6% |
| Median | 7.7% | 7.1% |
| Interquartile 25% (IQ1) | 5.2% | 4.5% |
| Interquartile 75% (IQ3) | 12.2% | 8.6% |
| Interquartile Range (IQR) | 7.0% | 4.1% |
| Standard Deviation (Sample) | 6.5% | 2.6% |
| Standard Deviation (Population) | 6.4% | 2.6% |
Similar Demographics by Unemployment Among Women with Children Under 6 years
Demographics Similar to Immigrants from Lithuania by Unemployment Among Women with Children Under 6 years
In terms of unemployment among women with children under 6 years, the demographic groups most similar to Immigrants from Lithuania are Immigrants from Western Asia (7.5%, a difference of 0.12%), Bolivian (7.5%, a difference of 0.16%), British (7.6%, a difference of 0.19%), Immigrants from Philippines (7.5%, a difference of 0.20%), and Ugandan (7.6%, a difference of 0.23%).
| Demographics | Rating | Rank | Unemployment Among Women with Children Under 6 years |
| South Americans | 74.1 /100 | #155 | Good 7.5% |
| Immigrants | Southern Europe | 73.2 /100 | #156 | Good 7.5% |
| Peruvians | 72.3 /100 | #157 | Good 7.5% |
| Croatians | 71.9 /100 | #158 | Good 7.5% |
| Immigrants | Philippines | 71.3 /100 | #159 | Good 7.5% |
| Bolivians | 70.8 /100 | #160 | Good 7.5% |
| Immigrants | Western Asia | 70.2 /100 | #161 | Good 7.5% |
| Immigrants | Lithuania | 68.8 /100 | #162 | Good 7.5% |
| British | 66.3 /100 | #163 | Good 7.6% |
| Ugandans | 65.8 /100 | #164 | Good 7.6% |
| Immigrants | South America | 65.6 /100 | #165 | Good 7.6% |
| Belgians | 63.5 /100 | #166 | Good 7.6% |
| Kenyans | 62.5 /100 | #167 | Good 7.6% |
| Immigrants | Canada | 61.6 /100 | #168 | Good 7.6% |
| Immigrants | Scotland | 61.3 /100 | #169 | Good 7.6% |
Demographics Similar to Immigrants from Venezuela by Unemployment Among Women with Children Under 6 years
In terms of unemployment among women with children under 6 years, the demographic groups most similar to Immigrants from Venezuela are Immigrants from Greece (7.1%, a difference of 0.040%), Immigrants from Fiji (7.1%, a difference of 0.060%), Immigrants from Somalia (7.1%, a difference of 0.11%), Immigrants from Croatia (7.1%, a difference of 0.15%), and Immigrants from Afghanistan (7.1%, a difference of 0.15%).
| Demographics | Rating | Rank | Unemployment Among Women with Children Under 6 years |
| Turks | 99.2 /100 | #74 | Exceptional 7.0% |
| Immigrants | Eastern Europe | 99.0 /100 | #75 | Exceptional 7.1% |
| Estonians | 99.0 /100 | #76 | Exceptional 7.1% |
| Immigrants | Croatia | 98.9 /100 | #77 | Exceptional 7.1% |
| Immigrants | Somalia | 98.9 /100 | #78 | Exceptional 7.1% |
| Immigrants | Fiji | 98.9 /100 | #79 | Exceptional 7.1% |
| Immigrants | Greece | 98.9 /100 | #80 | Exceptional 7.1% |
| Immigrants | Venezuela | 98.8 /100 | #81 | Exceptional 7.1% |
| Immigrants | Afghanistan | 98.7 /100 | #82 | Exceptional 7.1% |
| Egyptians | 98.7 /100 | #83 | Exceptional 7.1% |
| Immigrants | Albania | 98.7 /100 | #84 | Exceptional 7.1% |
| Immigrants | Romania | 98.7 /100 | #85 | Exceptional 7.1% |
| Immigrants | Zimbabwe | 98.6 /100 | #86 | Exceptional 7.1% |
| Alsatians | 98.4 /100 | #87 | Exceptional 7.1% |
| Immigrants | Hungary | 98.3 /100 | #88 | Exceptional 7.1% |