Immigrants from Lithuania vs Immigrants from Belarus Unemployment Among Ages 16 to 19 years

COMPARE

Immigrants from Lithuania
Race
Ancestry
AfghanAfricanAlaska NativeAlaskan AthabascanAlbanianAleutAlsatianAmericanApacheArabArapahoArgentineanArmenianAssyrian/Chaldean/SyriacAustralianAustrianBahamianBangladeshiBarbadianBasqueBelgianBelizeanBermudanBhutaneseBlackfeetBolivianBrazilianBritishBritish West IndianBulgarianBurmeseCajunCambodianCanadianCape VerdeanCarpatho RusynCelticCentral AmericanCentral American IndianCherokeeCheyenneChickasawChileanChineseChippewaChoctawColombianColvilleComancheCosta RicanCreeCreekCroatianCrowCubanCypriotCzechCzechoslovakianDanishDelawareDominicanDutchDutch West IndianEastern EuropeanEcuadorianEgyptianEnglishEstonianEthiopianEuropeanFijianFilipinoFinnishFrenchFrench American IndianFrench CanadianGermanGerman RussianGhanaianGreekGuamanian/ChamorroGuatemalanGuyaneseHaitianHmongHonduranHopiHoumaHungarianIcelanderIndian (Asian)IndonesianInupiatIranianIraqiIrishIroquoisIsraeliItalianJamaicanJapaneseJordanianKenyanKiowaKoreanLaotianLatvianLebaneseLiberianLithuanianLumbeeLuxembourgerMacedonianMalaysianMalteseMarshalleseMenomineeMexicanMexican American IndianMongolianMoroccanNative HawaiianNavajoNepaleseNew ZealanderNicaraguanNigerianNorthern EuropeanNorwegianOkinawanOsageOttawaPaiutePakistaniPalestinianPanamanianParaguayanPennsylvania GermanPeruvianPimaPolishPortuguesePotawatomiPuebloPuerto RicanPuget Sound SalishRomanianRussianSalvadoranSamoanScandinavianScotch-IrishScottishSeminoleSenegaleseSerbianShoshoneSierra LeoneanSiouxSlavicSlovakSloveneSomaliSouth AfricanSouth AmericanSouth American IndianSoviet UnionSpaniardSpanishSpanish AmericanSpanish American IndianSri LankanSubsaharan AfricanSudaneseSwedishSwissSyrianTaiwaneseThaiTlingit-HaidaTohono O'OdhamTonganTrinidadian and TobagonianTsimshianTurkishU.S. Virgin IslanderUgandanUkrainianUruguayanUteVenezuelanVietnameseWelshWest IndianYakamaYaquiYugoslavianYumanYup'ikZimbabwean
Immigration
NonimmigrantsImmigrantsAfghanistanAfricaAlbaniaArgentinaArmeniaAsiaAustraliaAustriaBahamasBangladeshBarbadosBelgiumBelizeBoliviaBosnia and HerzegovinaBrazilBulgariaBurma/MyanmarCabo VerdeCambodiaCameroonCanadaCaribbeanCentral AmericaChileChinaColombiaCongoCosta RicaCroatiaCubaCzechoslovakiaDenmarkDominicaDominican RepublicEastern AfricaEastern AsiaEastern EuropeEcuadorEgyptEl SalvadorEnglandEritreaEthiopiaEuropeFijiFranceGermanyGhanaGreeceGrenadaGuatemalaGuyanaHaitiHondurasHong KongHungaryIndiaIndonesiaIranIraqIrelandIsraelItalyJamaicaJapanJordanKazakhstanKenyaKoreaKuwaitLaosLatin AmericaLatviaLebanonLiberiaLithuaniaMalaysiaMexicoMicronesiaMiddle AfricaMoldovaMoroccoNepalNetherlandsNicaraguaNigeriaNorth AmericaNorth MacedoniaNorthern AfricaNorthern EuropeNorwayOceaniaPakistanPanamaPeruPhilippinesPolandPortugalRomaniaRussiaSaudi ArabiaScotlandSenegalSerbiaSierra LeoneSingaporeSomaliaSouth AfricaSouth AmericaSouth Central AsiaSouth Eastern AsiaSouthern EuropeSpainSri LankaSt. Vincent and the GrenadinesSudanSwedenSwitzerlandSyriaTaiwanThailandTrinidad and TobagoTurkeyUgandaUkraineUruguayUzbekistanVenezuelaVietnamWest IndiesWestern AfricaWestern AsiaWestern EuropeYemenZaireZimbabweAzores
Immigrants from Belarus
Race
Ancestry
AfghanAfricanAlaska NativeAlaskan AthabascanAlbanianAleutAlsatianAmericanApacheArabArapahoArgentineanArmenianAssyrian/Chaldean/SyriacAustralianAustrianBahamianBangladeshiBarbadianBasqueBelgianBelizeanBermudanBhutaneseBlackfeetBolivianBrazilianBritishBritish West IndianBulgarianBurmeseCajunCambodianCanadianCape VerdeanCarpatho RusynCelticCentral AmericanCentral American IndianCherokeeCheyenneChickasawChileanChineseChippewaChoctawColombianColvilleComancheCosta RicanCreeCreekCroatianCrowCubanCypriotCzechCzechoslovakianDanishDelawareDominicanDutchDutch West IndianEastern EuropeanEcuadorianEgyptianEnglishEstonianEthiopianEuropeanFijianFilipinoFinnishFrenchFrench American IndianFrench CanadianGermanGerman RussianGhanaianGreekGuamanian/ChamorroGuatemalanGuyaneseHaitianHmongHonduranHopiHoumaHungarianIcelanderIndian (Asian)IndonesianInupiatIranianIraqiIrishIroquoisIsraeliItalianJamaicanJapaneseJordanianKenyanKiowaKoreanLaotianLatvianLebaneseLiberianLithuanianLumbeeLuxembourgerMacedonianMalaysianMalteseMarshalleseMenomineeMexicanMexican American IndianMongolianMoroccanNative HawaiianNavajoNepaleseNew ZealanderNicaraguanNigerianNorthern EuropeanNorwegianOkinawanOsageOttawaPaiutePakistaniPalestinianPanamanianParaguayanPennsylvania GermanPeruvianPimaPolishPortuguesePotawatomiPuebloPuerto RicanPuget Sound SalishRomanianRussianSalvadoranSamoanScandinavianScotch-IrishScottishSeminoleSenegaleseSerbianShoshoneSierra LeoneanSiouxSlavicSlovakSloveneSomaliSouth AfricanSouth AmericanSouth American IndianSoviet UnionSpaniardSpanishSpanish AmericanSpanish American IndianSri LankanSubsaharan AfricanSudaneseSwedishSwissSyrianTaiwaneseThaiTlingit-HaidaTohono O'OdhamTonganTrinidadian and TobagonianTsimshianTurkishU.S. Virgin IslanderUgandanUkrainianUruguayanUteVenezuelanVietnameseWelshWest IndianYakamaYaquiYugoslavianYumanYup'ikZimbabwean
Immigration
NonimmigrantsImmigrantsAfghanistanAfricaAlbaniaArgentinaArmeniaAsiaAustraliaAustriaBahamasBangladeshBarbadosBelarusBelgiumBelizeBoliviaBosnia and HerzegovinaBrazilBulgariaBurma/MyanmarCabo VerdeCambodiaCameroonCanadaCaribbeanCentral AmericaChileChinaColombiaCongoCosta RicaCroatiaCubaCzechoslovakiaDenmarkDominicaDominican RepublicEastern AfricaEastern AsiaEastern EuropeEcuadorEgyptEl SalvadorEnglandEritreaEthiopiaEuropeFijiFranceGermanyGhanaGreeceGrenadaGuatemalaGuyanaHaitiHondurasHong KongHungaryIndiaIndonesiaIranIraqIrelandIsraelItalyJamaicaJapanJordanKazakhstanKenyaKoreaKuwaitLaosLatin AmericaLatviaLebanonLiberiaMalaysiaMexicoMicronesiaMiddle AfricaMoldovaMoroccoNepalNetherlandsNicaraguaNigeriaNorth AmericaNorth MacedoniaNorthern AfricaNorthern EuropeNorwayOceaniaPakistanPanamaPeruPhilippinesPolandPortugalRomaniaRussiaSaudi ArabiaScotlandSenegalSerbiaSierra LeoneSingaporeSomaliaSouth AfricaSouth AmericaSouth Central AsiaSouth Eastern AsiaSouthern EuropeSpainSri LankaSt. Vincent and the GrenadinesSudanSwedenSwitzerlandSyriaTaiwanThailandTrinidad and TobagoTurkeyUgandaUkraineUruguayUzbekistanVenezuelaVietnamWest IndiesWestern AfricaWestern AsiaWestern EuropeYemenZaireZimbabweAzores
Unemployment Among Ages 16 to 19 years
Income
Poverty
Unemployment
Labor Participation
Family Structure
Vehicle Availability
Education Level
Disability

Unemployment Among Ages 16 to 19 years Comparison

Immigrants from Lithuania

Immigrants from Belarus

Exceptional
Tragic
17.0%
UNEMPLOYMENT AMONG AGES 16 TO 19 YEARS
94.9/ 100
METRIC RATING
99th/ 347
METRIC RANK
18.6%
UNEMPLOYMENT AMONG AGES 16 TO 19 YEARS
0.8/ 100
METRIC RATING
245th/ 347
METRIC RANK

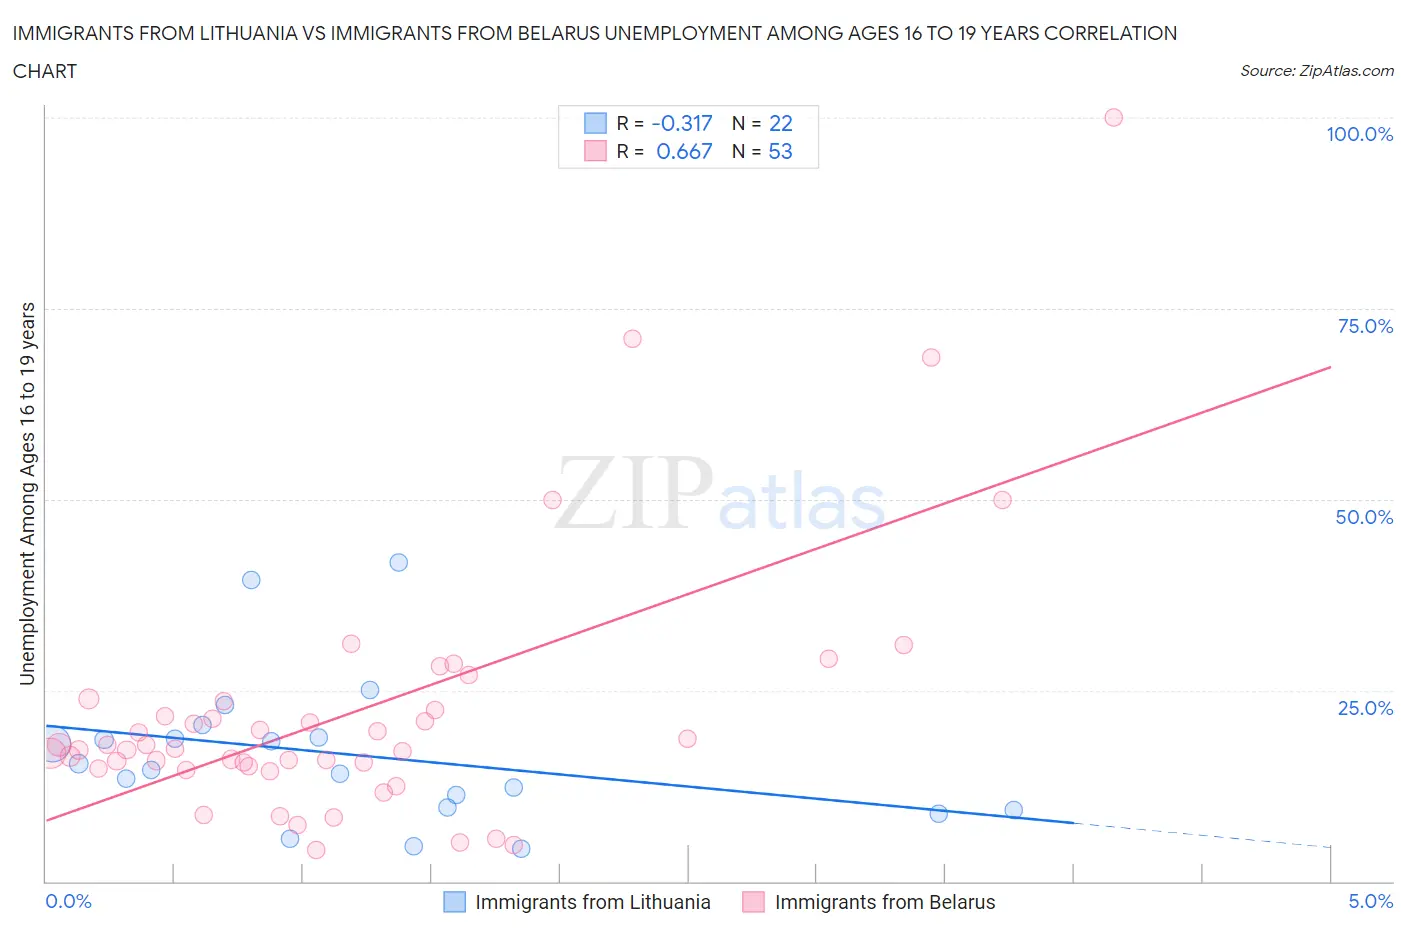
Immigrants from Lithuania vs Immigrants from Belarus Unemployment Among Ages 16 to 19 years Correlation Chart

The statistical analysis conducted on geographies consisting of 114,687,942 people shows a mild negative correlation between the proportion of Immigrants from Lithuania and unemployment rate among population between the ages 16 and 19 in the United States with a correlation coefficient (R) of -0.317 and weighted average of 17.0%. Similarly, the statistical analysis conducted on geographies consisting of 145,960,072 people shows a significant positive correlation between the proportion of Immigrants from Belarus and unemployment rate among population between the ages 16 and 19 in the United States with a correlation coefficient (R) of 0.667 and weighted average of 18.6%, a difference of 9.5%.
Immigrants from Lithuania vs Immigrants from Belarus Unemployment Among Ages 16 to 19 years

Unemployment Among Ages 16 to 19 years Correlation Summary

MeasurementImmigrants from LithuaniaImmigrants from Belarus
Minimum4.3%4.1%
Maximum41.8%100.0%
Range37.5%95.9%
Mean16.6%22.0%
Median15.0%17.4%
Interquartile 25% (IQ1)9.7%14.9%
Interquartile 75% (IQ3)18.8%23.1%
Interquartile Range (IQR)9.1%8.1%
Standard Deviation (Sample)9.6%17.2%
Standard Deviation (Population)9.4%17.0%

Similar Demographics by Unemployment Among Ages 16 to 19 years

Demographics Similar to Immigrants from Lithuania by Unemployment Among Ages 16 to 19 years

In terms of unemployment among ages 16 to 19 years, the demographic groups most similar to Immigrants from Lithuania are Burmese (17.0%, a difference of 0.020%), Immigrants from Thailand (17.0%, a difference of 0.040%), Immigrants from Saudi Arabia (17.0%, a difference of 0.050%), Immigrants from Pakistan (17.0%, a difference of 0.070%), and Palestinian (17.0%, a difference of 0.080%).
DemographicsRating | RankUnemployment Among Ages 16 to 19 years
South Africans
95.9
/100
|
#92
Exceptional
16.9%
Cubans
95.8
/100
|
#93
Exceptional
16.9%
Bangladeshis
95.8
/100
|
#94
Exceptional
16.9%
Mongolians
95.6
/100
|
#95
Exceptional
16.9%
Ottawa
95.4
/100
|
#96
Exceptional
16.9%
Immigrants | Venezuela
95.3
/100
|
#97
Exceptional
16.9%
Burmese
95.0
/100
|
#98
Exceptional
17.0%
Immigrants | Lithuania
94.9
/100
|
#99
Exceptional
17.0%
Immigrants | Thailand
94.7
/100
|
#100
Exceptional
17.0%
Immigrants | Saudi Arabia
94.7
/100
|
#101
Exceptional
17.0%
Immigrants | Pakistan
94.6
/100
|
#102
Exceptional
17.0%
Palestinians
94.6
/100
|
#103
Exceptional
17.0%
Italians
94.5
/100
|
#104
Exceptional
17.0%
Immigrants | Bulgaria
94.3
/100
|
#105
Exceptional
17.0%
Estonians
94.3
/100
|
#106
Exceptional
17.0%

Demographics Similar to Immigrants from Belarus by Unemployment Among Ages 16 to 19 years

In terms of unemployment among ages 16 to 19 years, the demographic groups most similar to Immigrants from Belarus are Guatemalan (18.6%, a difference of 0.010%), Mexican (18.5%, a difference of 0.22%), Moroccan (18.5%, a difference of 0.38%), Immigrants from South America (18.7%, a difference of 0.42%), and Immigrants from Israel (18.7%, a difference of 0.47%).
DemographicsRating | RankUnemployment Among Ages 16 to 19 years
South Americans
2.6
/100
|
#238
Tragic
18.3%
Native Hawaiians
2.4
/100
|
#239
Tragic
18.3%
Immigrants | Cabo Verde
2.0
/100
|
#240
Tragic
18.4%
Immigrants | Ukraine
1.3
/100
|
#241
Tragic
18.5%
Moroccans
1.1
/100
|
#242
Tragic
18.5%
Mexicans
0.9
/100
|
#243
Tragic
18.5%
Guatemalans
0.8
/100
|
#244
Tragic
18.6%
Immigrants | Belarus
0.8
/100
|
#245
Tragic
18.6%
Immigrants | South America
0.5
/100
|
#246
Tragic
18.7%
Immigrants | Israel
0.5
/100
|
#247
Tragic
18.7%
Delaware
0.5
/100
|
#248
Tragic
18.7%
Puget Sound Salish
0.5
/100
|
#249
Tragic
18.7%
Panamanians
0.4
/100
|
#250
Tragic
18.7%
Sub-Saharan Africans
0.4
/100
|
#251
Tragic
18.7%
Immigrants | Guatemala
0.4
/100
|
#252
Tragic
18.7%