Immigrants from Liberia vs Liberian Unemployment Among Ages 30 to 34 years
COMPARE
Immigrants from Liberia
Liberian
Unemployment Among Ages 30 to 34 years
Unemployment Among Ages 30 to 34 years Comparison
Immigrants from Liberia
Liberians
6.0%
UNEMPLOYMENT AMONG AGES 30 TO 34 YEARS
0.4/ 100
METRIC RATING
243rd/ 347
METRIC RANK
5.8%
UNEMPLOYMENT AMONG AGES 30 TO 34 YEARS
2.3/ 100
METRIC RATING
226th/ 347
METRIC RANK
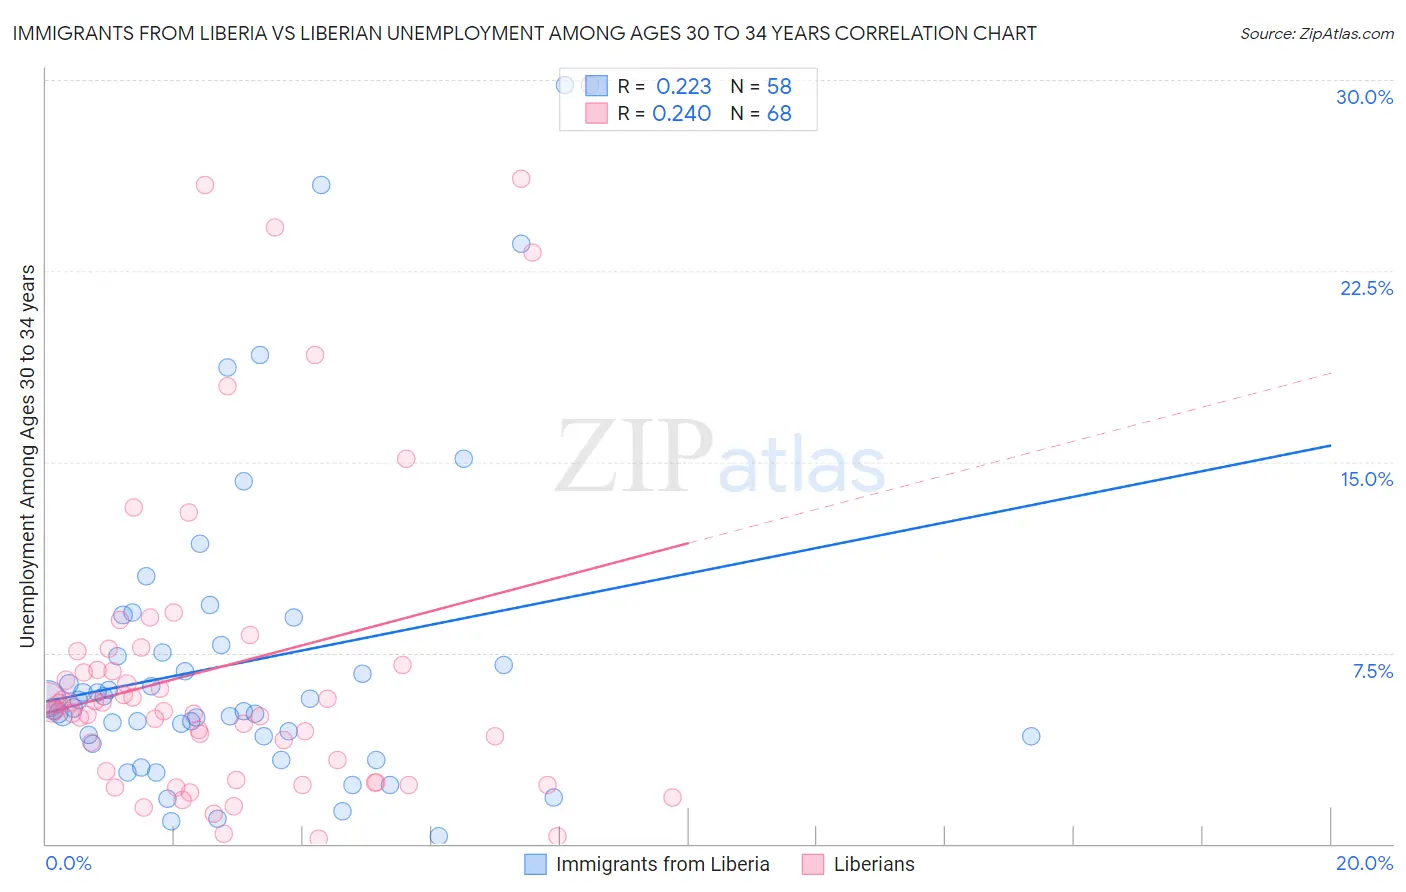
Immigrants from Liberia vs Liberian Unemployment Among Ages 30 to 34 years Correlation Chart
The statistical analysis conducted on geographies consisting of 133,386,885 people shows a weak positive correlation between the proportion of Immigrants from Liberia and unemployment rate among population between the ages 30 and 34 in the United States with a correlation coefficient (R) of 0.223 and weighted average of 6.0%. Similarly, the statistical analysis conducted on geographies consisting of 116,509,188 people shows a weak positive correlation between the proportion of Liberians and unemployment rate among population between the ages 30 and 34 in the United States with a correlation coefficient (R) of 0.240 and weighted average of 5.8%, a difference of 3.0%.
Unemployment Among Ages 30 to 34 years Correlation Summary
| Measurement | Immigrants from Liberia | Liberian |
| Minimum | 0.30% | 0.20% |
| Maximum | 29.8% | 29.8% |
| Range | 29.5% | 29.6% |
| Mean | 7.1% | 7.0% |
| Median | 5.3% | 5.2% |
| Interquartile 25% (IQ1) | 4.2% | 2.7% |
| Interquartile 75% (IQ3) | 7.5% | 7.3% |
| Interquartile Range (IQR) | 3.3% | 4.6% |
| Standard Deviation (Sample) | 6.0% | 6.5% |
| Standard Deviation (Population) | 5.9% | 6.5% |
Demographics Similar to Immigrants from Liberia and Liberians by Unemployment Among Ages 30 to 34 years
In terms of unemployment among ages 30 to 34 years, the demographic groups most similar to Immigrants from Liberia are Guatemalan (6.0%, a difference of 0.060%), Immigrants from Micronesia (6.0%, a difference of 0.15%), Immigrants from El Salvador (6.0%, a difference of 0.28%), Salvadoran (6.0%, a difference of 0.36%), and Immigrants from Nigeria (6.0%, a difference of 0.62%). Similarly, the demographic groups most similar to Liberians are Samoan (5.8%, a difference of 0.13%), Slovak (5.8%, a difference of 0.15%), Spanish (5.8%, a difference of 0.35%), Immigrants from Bahamas (5.8%, a difference of 0.42%), and Immigrants from Uzbekistan (5.9%, a difference of 0.73%).
| Demographics | Rating | Rank | Unemployment Among Ages 30 to 34 years |
| Slovaks | 2.5 /100 | #224 | Tragic 5.8% |
| Samoans | 2.5 /100 | #225 | Tragic 5.8% |
| Liberians | 2.3 /100 | #226 | Tragic 5.8% |
| Spanish | 1.8 /100 | #227 | Tragic 5.8% |
| Immigrants | Bahamas | 1.8 /100 | #228 | Tragic 5.8% |
| Immigrants | Uzbekistan | 1.5 /100 | #229 | Tragic 5.9% |
| Hawaiians | 1.2 /100 | #230 | Tragic 5.9% |
| Japanese | 1.1 /100 | #231 | Tragic 5.9% |
| Iroquois | 1.0 /100 | #232 | Tragic 5.9% |
| Nepalese | 0.8 /100 | #233 | Tragic 5.9% |
| Portuguese | 0.8 /100 | #234 | Tragic 5.9% |
| Yaqui | 0.7 /100 | #235 | Tragic 5.9% |
| Native Hawaiians | 0.7 /100 | #236 | Tragic 5.9% |
| Central Americans | 0.6 /100 | #237 | Tragic 5.9% |
| Mexican American Indians | 0.6 /100 | #238 | Tragic 5.9% |
| Immigrants | Nigeria | 0.6 /100 | #239 | Tragic 6.0% |
| Salvadorans | 0.5 /100 | #240 | Tragic 6.0% |
| Immigrants | El Salvador | 0.5 /100 | #241 | Tragic 6.0% |
| Guatemalans | 0.4 /100 | #242 | Tragic 6.0% |
| Immigrants | Liberia | 0.4 /100 | #243 | Tragic 6.0% |
| Immigrants | Micronesia | 0.3 /100 | #244 | Tragic 6.0% |