Immigrants from Liberia vs Inupiat Unemployment Among Ages 55 to 59 years
COMPARE
Immigrants from Liberia
Inupiat
Unemployment Among Ages 55 to 59 years
Unemployment Among Ages 55 to 59 years Comparison
Immigrants from Liberia
Inupiat
5.0%
UNEMPLOYMENT AMONG AGES 55 TO 59 YEARS
3.2/ 100
METRIC RATING
228th/ 347
METRIC RANK
9.0%
UNEMPLOYMENT AMONG AGES 55 TO 59 YEARS
0.0/ 100
METRIC RATING
344th/ 347
METRIC RANK
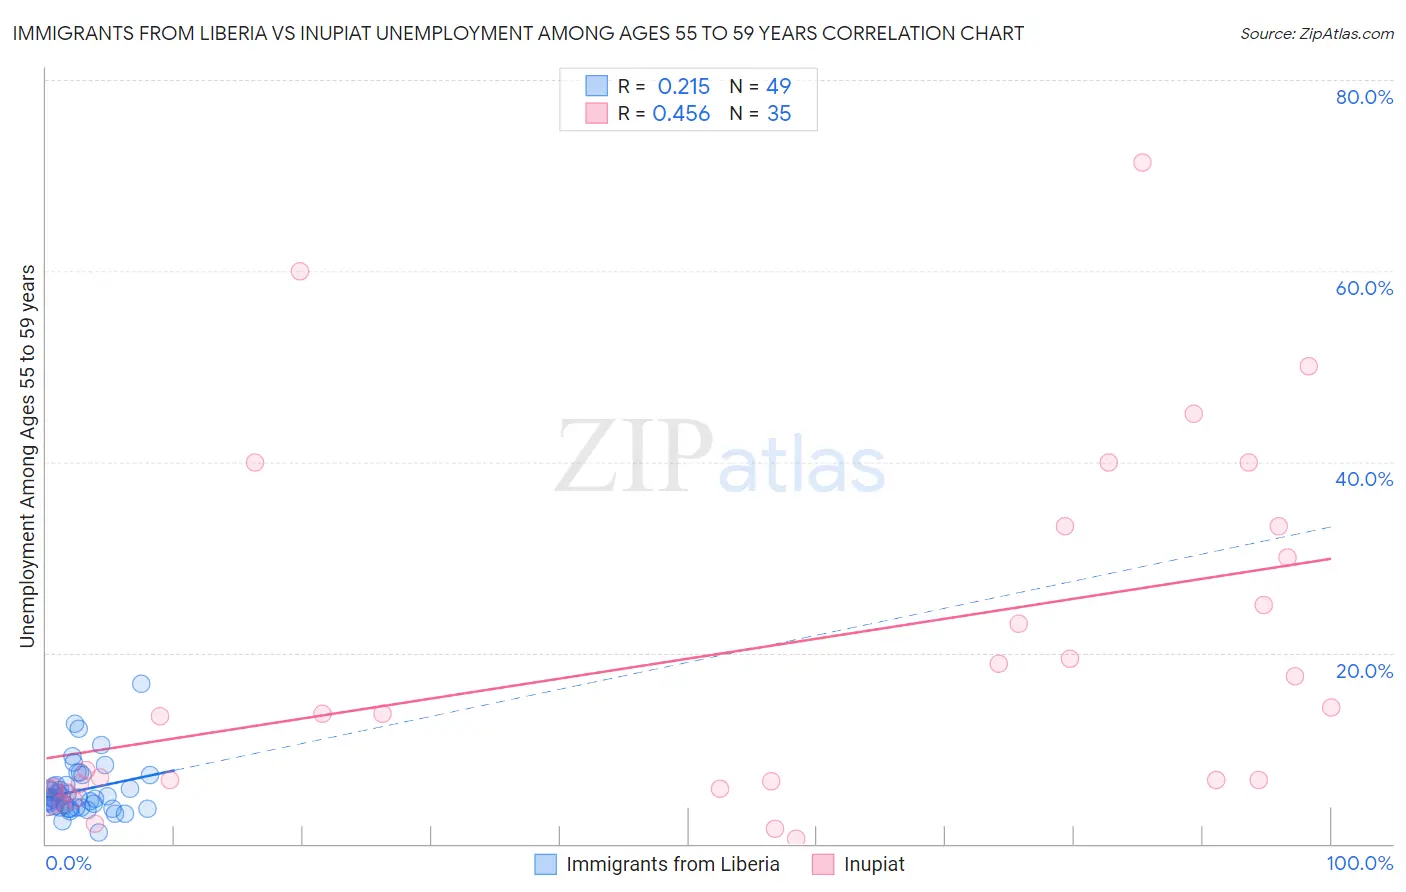
Immigrants from Liberia vs Inupiat Unemployment Among Ages 55 to 59 years Correlation Chart
The statistical analysis conducted on geographies consisting of 131,927,526 people shows a weak positive correlation between the proportion of Immigrants from Liberia and unemployment rate among population between the ages 55 and 59 in the United States with a correlation coefficient (R) of 0.215 and weighted average of 5.0%. Similarly, the statistical analysis conducted on geographies consisting of 93,729,487 people shows a moderate positive correlation between the proportion of Inupiat and unemployment rate among population between the ages 55 and 59 in the United States with a correlation coefficient (R) of 0.456 and weighted average of 9.0%, a difference of 81.3%.
Unemployment Among Ages 55 to 59 years Correlation Summary
| Measurement | Immigrants from Liberia | Inupiat |
| Minimum | 1.2% | 0.50% |
| Maximum | 16.7% | 71.4% |
| Range | 15.5% | 70.9% |
| Mean | 5.6% | 19.5% |
| Median | 4.8% | 13.6% |
| Interquartile 25% (IQ1) | 3.8% | 6.0% |
| Interquartile 75% (IQ3) | 6.2% | 33.3% |
| Interquartile Range (IQR) | 2.4% | 27.3% |
| Standard Deviation (Sample) | 2.8% | 18.2% |
| Standard Deviation (Population) | 2.8% | 17.9% |
Similar Demographics by Unemployment Among Ages 55 to 59 years
Demographics Similar to Immigrants from Liberia by Unemployment Among Ages 55 to 59 years
In terms of unemployment among ages 55 to 59 years, the demographic groups most similar to Immigrants from Liberia are Immigrants from Western Asia (5.0%, a difference of 0.080%), Immigrants from Iran (5.0%, a difference of 0.13%), Immigrants from Syria (5.0%, a difference of 0.18%), Cherokee (5.0%, a difference of 0.21%), and Immigrants from China (5.0%, a difference of 0.26%).
| Demographics | Rating | Rank | Unemployment Among Ages 55 to 59 years |
| Nigerians | 7.5 /100 | #221 | Tragic 4.9% |
| Spanish | 5.1 /100 | #222 | Tragic 5.0% |
| Immigrants | Ireland | 4.8 /100 | #223 | Tragic 5.0% |
| Sub-Saharan Africans | 4.4 /100 | #224 | Tragic 5.0% |
| Costa Ricans | 4.4 /100 | #225 | Tragic 5.0% |
| Immigrants | China | 4.2 /100 | #226 | Tragic 5.0% |
| Immigrants | Iran | 3.7 /100 | #227 | Tragic 5.0% |
| Immigrants | Liberia | 3.2 /100 | #228 | Tragic 5.0% |
| Immigrants | Western Asia | 3.0 /100 | #229 | Tragic 5.0% |
| Immigrants | Syria | 2.7 /100 | #230 | Tragic 5.0% |
| Cherokee | 2.6 /100 | #231 | Tragic 5.0% |
| Albanians | 2.5 /100 | #232 | Tragic 5.0% |
| Immigrants | Immigrants | 2.3 /100 | #233 | Tragic 5.0% |
| Immigrants | Southern Europe | 1.8 /100 | #234 | Tragic 5.0% |
| Immigrants | Hong Kong | 1.4 /100 | #235 | Tragic 5.0% |
Demographics Similar to Inupiat by Unemployment Among Ages 55 to 59 years
In terms of unemployment among ages 55 to 59 years, the demographic groups most similar to Inupiat are Yakama (8.9%, a difference of 1.2%), Tohono O'odham (9.3%, a difference of 3.0%), Hopi (8.1%, a difference of 11.3%), Menominee (10.5%, a difference of 16.6%), and Shoshone (7.4%, a difference of 22.6%).
| Demographics | Rating | Rank | Unemployment Among Ages 55 to 59 years |
| Pima | 0.0 /100 | #333 | Tragic 6.6% |
| Pueblo | 0.0 /100 | #334 | Tragic 6.7% |
| Colville | 0.0 /100 | #335 | Tragic 6.7% |
| Navajo | 0.0 /100 | #336 | Tragic 6.7% |
| Paiute | 0.0 /100 | #337 | Tragic 6.8% |
| Immigrants | Yemen | 0.0 /100 | #338 | Tragic 6.9% |
| Puerto Ricans | 0.0 /100 | #339 | Tragic 7.0% |
| Alaskan Athabascans | 0.0 /100 | #340 | Tragic 7.1% |
| Shoshone | 0.0 /100 | #341 | Tragic 7.4% |
| Hopi | 0.0 /100 | #342 | Tragic 8.1% |
| Yakama | 0.0 /100 | #343 | Tragic 8.9% |
| Inupiat | 0.0 /100 | #344 | Tragic 9.0% |
| Tohono O'odham | 0.0 /100 | #345 | Tragic 9.3% |
| Menominee | 0.0 /100 | #346 | Tragic 10.5% |
| Yup'ik | 0.0 /100 | #347 | Tragic 13.9% |