Immigrants from Liberia vs German Russian Unemployment Among Ages 16 to 19 years

COMPARE

Immigrants from Liberia
Race
Ancestry
AfghanAfricanAlaska NativeAlaskan AthabascanAlbanianAleutAlsatianAmericanApacheArabArapahoArgentineanArmenianAssyrian/Chaldean/SyriacAustralianAustrianBahamianBangladeshiBarbadianBasqueBelgianBelizeanBermudanBhutaneseBlackfeetBolivianBrazilianBritishBritish West IndianBulgarianBurmeseCajunCambodianCanadianCape VerdeanCarpatho RusynCelticCentral AmericanCentral American IndianCherokeeCheyenneChickasawChileanChineseChippewaChoctawColombianColvilleComancheCosta RicanCreeCreekCroatianCrowCubanCypriotCzechCzechoslovakianDanishDelawareDominicanDutchDutch West IndianEastern EuropeanEcuadorianEgyptianEnglishEstonianEthiopianEuropeanFijianFilipinoFinnishFrenchFrench American IndianFrench CanadianGermanGhanaianGreekGuamanian/ChamorroGuatemalanGuyaneseHaitianHmongHonduranHopiHoumaHungarianIcelanderIndian (Asian)IndonesianInupiatIranianIraqiIrishIroquoisIsraeliItalianJamaicanJapaneseJordanianKenyanKiowaKoreanLaotianLatvianLebaneseLiberianLithuanianLumbeeLuxembourgerMacedonianMalaysianMalteseMarshalleseMenomineeMexicanMexican American IndianMongolianMoroccanNative HawaiianNavajoNepaleseNew ZealanderNicaraguanNigerianNorthern EuropeanNorwegianOkinawanOsageOttawaPaiutePakistaniPalestinianPanamanianParaguayanPennsylvania GermanPeruvianPimaPolishPortuguesePotawatomiPuebloPuerto RicanPuget Sound SalishRomanianRussianSalvadoranSamoanScandinavianScotch-IrishScottishSeminoleSenegaleseSerbianShoshoneSierra LeoneanSiouxSlavicSlovakSloveneSomaliSouth AfricanSouth AmericanSouth American IndianSoviet UnionSpaniardSpanishSpanish AmericanSpanish American IndianSri LankanSubsaharan AfricanSudaneseSwedishSwissSyrianTaiwaneseThaiTlingit-HaidaTohono O'OdhamTonganTrinidadian and TobagonianTsimshianTurkishU.S. Virgin IslanderUgandanUkrainianUruguayanUteVenezuelanVietnameseWelshWest IndianYakamaYaquiYugoslavianYumanYup'ikZimbabwean
Immigration
NonimmigrantsImmigrantsAfghanistanAfricaAlbaniaArgentinaArmeniaAsiaAustraliaAustriaBahamasBangladeshBarbadosBelarusBelgiumBelizeBoliviaBosnia and HerzegovinaBrazilBulgariaBurma/MyanmarCabo VerdeCambodiaCameroonCanadaCaribbeanCentral AmericaChileChinaColombiaCongoCosta RicaCroatiaCubaCzechoslovakiaDenmarkDominicaDominican RepublicEastern AfricaEastern AsiaEastern EuropeEcuadorEgyptEl SalvadorEnglandEritreaEthiopiaEuropeFijiFranceGermanyGhanaGreeceGrenadaGuatemalaGuyanaHaitiHondurasHong KongHungaryIndiaIndonesiaIranIraqIrelandIsraelItalyJamaicaJapanJordanKazakhstanKenyaKoreaKuwaitLaosLatin AmericaLatviaLebanonLiberiaLithuaniaMalaysiaMexicoMicronesiaMiddle AfricaMoldovaMoroccoNepalNetherlandsNicaraguaNigeriaNorth AmericaNorth MacedoniaNorthern AfricaNorthern EuropeNorwayOceaniaPakistanPanamaPeruPhilippinesPolandPortugalRomaniaRussiaSaudi ArabiaScotlandSenegalSerbiaSierra LeoneSingaporeSomaliaSouth AfricaSouth AmericaSouth Central AsiaSouth Eastern AsiaSouthern EuropeSpainSri LankaSt. Vincent and the GrenadinesSudanSwedenSwitzerlandSyriaTaiwanThailandTrinidad and TobagoTurkeyUgandaUkraineUruguayUzbekistanVenezuelaVietnamWest IndiesWestern AfricaWestern AsiaWestern EuropeYemenZaireZimbabweAzores
German Russian
Race
Ancestry
AfghanAfricanAlaska NativeAlaskan AthabascanAlbanianAleutAlsatianAmericanApacheArabArapahoArgentineanArmenianAssyrian/Chaldean/SyriacAustralianAustrianBahamianBangladeshiBarbadianBasqueBelgianBelizeanBermudanBhutaneseBlackfeetBolivianBrazilianBritishBritish West IndianBulgarianBurmeseCajunCambodianCanadianCape VerdeanCarpatho RusynCelticCentral AmericanCentral American IndianCherokeeCheyenneChickasawChileanChineseChippewaChoctawColombianColvilleComancheCosta RicanCreeCreekCroatianCrowCubanCypriotCzechCzechoslovakianDanishDelawareDominicanDutchDutch West IndianEastern EuropeanEcuadorianEgyptianEnglishEstonianEthiopianEuropeanFijianFilipinoFinnishFrenchFrench American IndianFrench CanadianGermanGerman RussianGhanaianGreekGuamanian/ChamorroGuatemalanGuyaneseHaitianHmongHonduranHopiHoumaHungarianIcelanderIndian (Asian)IndonesianInupiatIranianIraqiIrishIroquoisIsraeliItalianJamaicanJapaneseJordanianKenyanKiowaKoreanLaotianLatvianLebaneseLiberianLithuanianLumbeeLuxembourgerMacedonianMalaysianMalteseMarshalleseMenomineeMexicanMexican American IndianMongolianMoroccanNative HawaiianNavajoNepaleseNew ZealanderNicaraguanNigerianNorthern EuropeanNorwegianOkinawanOsageOttawaPaiutePakistaniPalestinianPanamanianParaguayanPennsylvania GermanPeruvianPimaPolishPortuguesePotawatomiPuebloPuerto RicanPuget Sound SalishRomanianRussianSalvadoranSamoanScandinavianScotch-IrishScottishSeminoleSenegaleseSerbianShoshoneSierra LeoneanSiouxSlavicSlovakSloveneSomaliSouth AfricanSouth AmericanSouth American IndianSoviet UnionSpaniardSpanishSpanish AmericanSpanish American IndianSri LankanSubsaharan AfricanSudaneseSwedishSwissSyrianTaiwaneseThaiTlingit-HaidaTohono O'OdhamTonganTrinidadian and TobagonianTsimshianTurkishU.S. Virgin IslanderUgandanUkrainianUruguayanUteVenezuelanVietnameseWelshWest IndianYakamaYaquiYugoslavianYumanYup'ikZimbabwean
Immigration
NonimmigrantsImmigrantsAfghanistanAfricaAlbaniaArgentinaArmeniaAsiaAustraliaAustriaBahamasBangladeshBarbadosBelarusBelgiumBelizeBoliviaBosnia and HerzegovinaBrazilBulgariaBurma/MyanmarCabo VerdeCambodiaCameroonCanadaCaribbeanCentral AmericaChileChinaColombiaCongoCosta RicaCroatiaCubaCzechoslovakiaDenmarkDominicaDominican RepublicEastern AfricaEastern AsiaEastern EuropeEcuadorEgyptEl SalvadorEnglandEritreaEthiopiaEuropeFijiFranceGermanyGhanaGreeceGrenadaGuatemalaGuyanaHaitiHondurasHong KongHungaryIndiaIndonesiaIranIraqIrelandIsraelItalyJamaicaJapanJordanKazakhstanKenyaKoreaKuwaitLaosLatin AmericaLatviaLebanonLithuaniaMalaysiaMexicoMicronesiaMiddle AfricaMoldovaMoroccoNepalNetherlandsNicaraguaNigeriaNorth AmericaNorth MacedoniaNorthern AfricaNorthern EuropeNorwayOceaniaPakistanPanamaPeruPhilippinesPolandPortugalRomaniaRussiaSaudi ArabiaScotlandSenegalSerbiaSierra LeoneSingaporeSomaliaSouth AfricaSouth AmericaSouth Central AsiaSouth Eastern AsiaSouthern EuropeSpainSri LankaSt. Vincent and the GrenadinesSudanSwedenSwitzerlandSyriaTaiwanThailandTrinidad and TobagoTurkeyUgandaUkraineUruguayUzbekistanVenezuelaVietnamWest IndiesWestern AfricaWestern AsiaWestern EuropeYemenZaireZimbabweAzores
Unemployment Among Ages 16 to 19 years
Income
Poverty
Unemployment
Labor Participation
Family Structure
Vehicle Availability
Education Level
Disability

Unemployment Among Ages 16 to 19 years Comparison

Immigrants from Liberia

German Russians

Tragic
Excellent
18.1%
UNEMPLOYMENT AMONG AGES 16 TO 19 YEARS
7.1/ 100
METRIC RATING
227th/ 347
METRIC RANK
17.2%
UNEMPLOYMENT AMONG AGES 16 TO 19 YEARS
84.1/ 100
METRIC RATING
131st/ 347
METRIC RANK

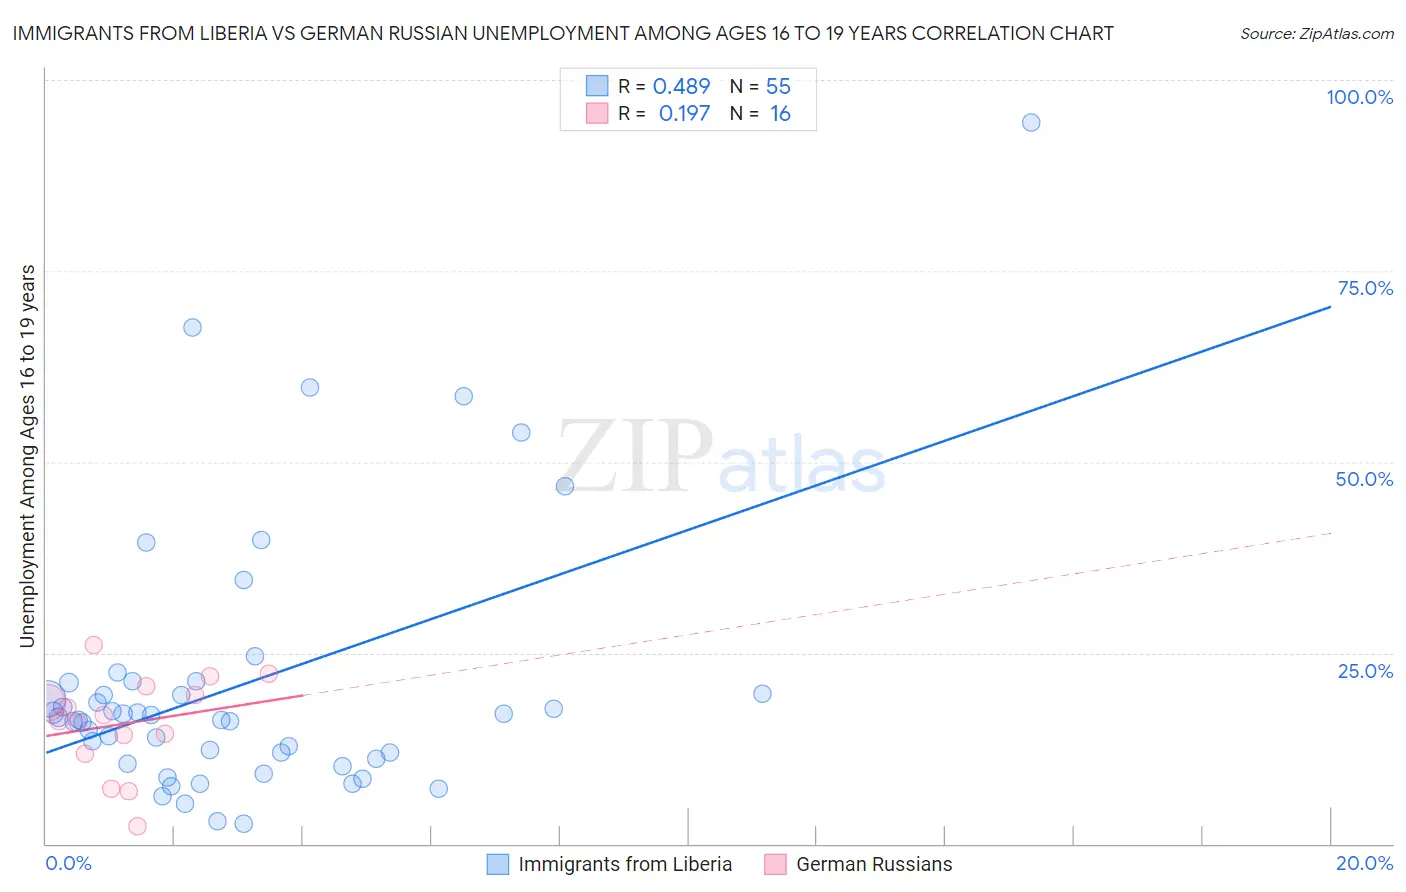
Immigrants from Liberia vs German Russian Unemployment Among Ages 16 to 19 years Correlation Chart

The statistical analysis conducted on geographies consisting of 133,284,598 people shows a moderate positive correlation between the proportion of Immigrants from Liberia and unemployment rate among population between the ages 16 and 19 in the United States with a correlation coefficient (R) of 0.489 and weighted average of 18.1%. Similarly, the statistical analysis conducted on geographies consisting of 94,923,342 people shows a poor positive correlation between the proportion of German Russians and unemployment rate among population between the ages 16 and 19 in the United States with a correlation coefficient (R) of 0.197 and weighted average of 17.2%, a difference of 5.1%.
Immigrants from Liberia vs German Russian Unemployment Among Ages 16 to 19 years

Unemployment Among Ages 16 to 19 years Correlation Summary

MeasurementImmigrants from LiberiaGerman Russian
Minimum2.6%2.3%
Maximum94.4%26.1%
Range91.8%23.8%
Mean20.9%15.8%
Median16.6%16.5%
Interquartile 25% (IQ1)11.2%13.0%
Interquartile 75% (IQ3)21.1%20.1%
Interquartile Range (IQR)9.9%7.0%
Standard Deviation (Sample)17.5%6.3%
Standard Deviation (Population)17.3%6.1%

Similar Demographics by Unemployment Among Ages 16 to 19 years

Demographics Similar to Immigrants from Liberia by Unemployment Among Ages 16 to 19 years

In terms of unemployment among ages 16 to 19 years, the demographic groups most similar to Immigrants from Liberia are Immigrants from Greece (18.1%, a difference of 0.010%), Immigrants from Belgium (18.1%, a difference of 0.020%), Immigrants from Chile (18.1%, a difference of 0.060%), Immigrants from Serbia (18.1%, a difference of 0.18%), and Albanian (18.2%, a difference of 0.26%).
DemographicsRating | RankUnemployment Among Ages 16 to 19 years
Immigrants | Albania
11.4
/100
|
#220
Poor
18.0%
Immigrants | Spain
11.4
/100
|
#221
Poor
18.0%
Immigrants | Iran
10.7
/100
|
#222
Poor
18.0%
Immigrants | Western Asia
10.2
/100
|
#223
Poor
18.0%
Immigrants | Serbia
8.3
/100
|
#224
Tragic
18.1%
Immigrants | Chile
7.5
/100
|
#225
Tragic
18.1%
Immigrants | Belgium
7.3
/100
|
#226
Tragic
18.1%
Immigrants | Liberia
7.1
/100
|
#227
Tragic
18.1%
Immigrants | Greece
7.1
/100
|
#228
Tragic
18.1%
Albanians
5.8
/100
|
#229
Tragic
18.2%
Spanish Americans
4.7
/100
|
#230
Tragic
18.2%
Nepalese
4.2
/100
|
#231
Tragic
18.2%
Immigrants | Russia
4.0
/100
|
#232
Tragic
18.2%
Seminole
4.0
/100
|
#233
Tragic
18.2%
Colombians
3.7
/100
|
#234
Tragic
18.3%

Demographics Similar to German Russians by Unemployment Among Ages 16 to 19 years

In terms of unemployment among ages 16 to 19 years, the demographic groups most similar to German Russians are Arab (17.2%, a difference of 0.020%), Laotian (17.2%, a difference of 0.020%), Potawatomi (17.2%, a difference of 0.030%), Samoan (17.2%, a difference of 0.030%), and Immigrants from Indonesia (17.2%, a difference of 0.050%).
DemographicsRating | RankUnemployment Among Ages 16 to 19 years
Syrians
88.6
/100
|
#124
Excellent
17.1%
Immigrants | Germany
87.7
/100
|
#125
Excellent
17.2%
Immigrants | Bolivia
86.7
/100
|
#126
Excellent
17.2%
Pakistanis
85.8
/100
|
#127
Excellent
17.2%
Australians
85.6
/100
|
#128
Excellent
17.2%
Creek
85.5
/100
|
#129
Excellent
17.2%
Immigrants | Indonesia
84.7
/100
|
#130
Excellent
17.2%
German Russians
84.1
/100
|
#131
Excellent
17.2%
Arabs
83.9
/100
|
#132
Excellent
17.2%
Laotians
83.9
/100
|
#133
Excellent
17.2%
Potawatomi
83.8
/100
|
#134
Excellent
17.2%
Samoans
83.7
/100
|
#135
Excellent
17.2%
Immigrants | Oceania
83.1
/100
|
#136
Excellent
17.2%
Immigrants | Malaysia
82.8
/100
|
#137
Excellent
17.2%
Bolivians
81.9
/100
|
#138
Excellent
17.3%