Immigrants from Lebanon vs Alaskan Athabascan Unemployment Among Ages 25 to 29 years
COMPARE
Immigrants from Lebanon
Alaskan Athabascan
Unemployment Among Ages 25 to 29 years
Unemployment Among Ages 25 to 29 years Comparison
Immigrants from Lebanon
Alaskan Athabascans
6.3%
UNEMPLOYMENT AMONG AGES 25 TO 29 YEARS
97.8/ 100
METRIC RATING
65th/ 347
METRIC RANK
10.8%
UNEMPLOYMENT AMONG AGES 25 TO 29 YEARS
0.0/ 100
METRIC RATING
333rd/ 347
METRIC RANK
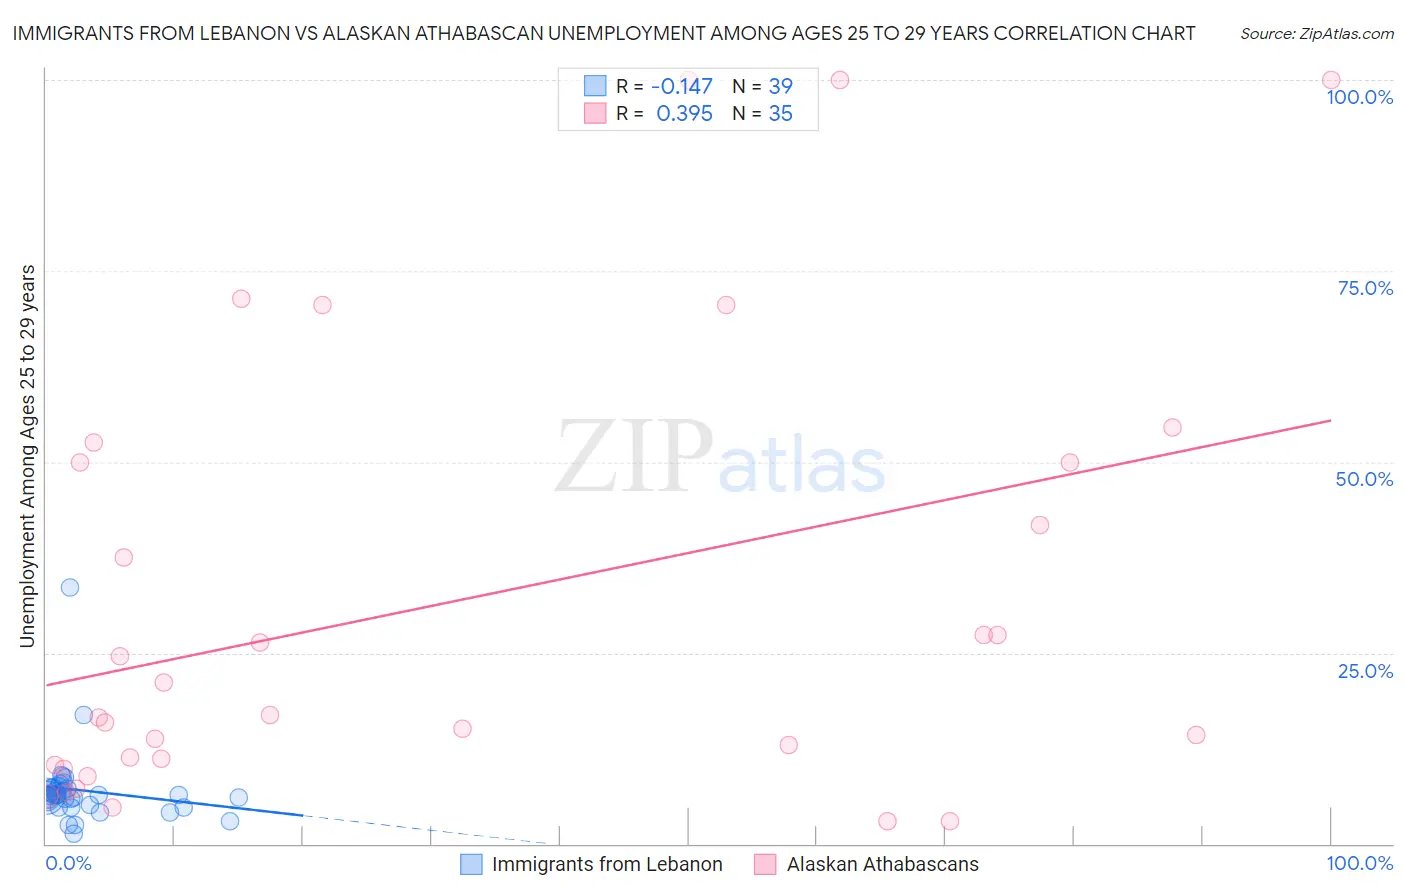
Immigrants from Lebanon vs Alaskan Athabascan Unemployment Among Ages 25 to 29 years Correlation Chart
The statistical analysis conducted on geographies consisting of 211,557,683 people shows a poor negative correlation between the proportion of Immigrants from Lebanon and unemployment rate among population between the ages 25 and 29 in the United States with a correlation coefficient (R) of -0.147 and weighted average of 6.3%. Similarly, the statistical analysis conducted on geographies consisting of 45,211,355 people shows a mild positive correlation between the proportion of Alaskan Athabascans and unemployment rate among population between the ages 25 and 29 in the United States with a correlation coefficient (R) of 0.395 and weighted average of 10.8%, a difference of 72.4%.
Unemployment Among Ages 25 to 29 years Correlation Summary
| Measurement | Immigrants from Lebanon | Alaskan Athabascan |
| Minimum | 1.3% | 2.9% |
| Maximum | 33.5% | 100.0% |
| Range | 32.2% | 97.1% |
| Mean | 7.0% | 31.8% |
| Median | 6.4% | 16.9% |
| Interquartile 25% (IQ1) | 5.0% | 10.4% |
| Interquartile 75% (IQ3) | 7.2% | 50.0% |
| Interquartile Range (IQR) | 2.2% | 39.6% |
| Standard Deviation (Sample) | 5.0% | 29.2% |
| Standard Deviation (Population) | 4.9% | 28.8% |
Similar Demographics by Unemployment Among Ages 25 to 29 years
Demographics Similar to Immigrants from Lebanon by Unemployment Among Ages 25 to 29 years
In terms of unemployment among ages 25 to 29 years, the demographic groups most similar to Immigrants from Lebanon are Indian (Asian) (6.3%, a difference of 0.020%), Immigrants from Northern Africa (6.3%, a difference of 0.030%), Immigrants from Sri Lanka (6.3%, a difference of 0.060%), Palestinian (6.3%, a difference of 0.070%), and Kenyan (6.3%, a difference of 0.10%).
| Demographics | Rating | Rank | Unemployment Among Ages 25 to 29 years |
| Immigrants | Eastern Asia | 98.4 /100 | #58 | Exceptional 6.2% |
| Luxembourgers | 98.3 /100 | #59 | Exceptional 6.2% |
| Immigrants | Taiwan | 98.3 /100 | #60 | Exceptional 6.2% |
| Bhutanese | 98.2 /100 | #61 | Exceptional 6.2% |
| Immigrants | China | 98.1 /100 | #62 | Exceptional 6.2% |
| Kenyans | 98.0 /100 | #63 | Exceptional 6.3% |
| Immigrants | Sri Lanka | 97.9 /100 | #64 | Exceptional 6.3% |
| Immigrants | Lebanon | 97.8 /100 | #65 | Exceptional 6.3% |
| Indians (Asian) | 97.8 /100 | #66 | Exceptional 6.3% |
| Immigrants | Northern Africa | 97.8 /100 | #67 | Exceptional 6.3% |
| Palestinians | 97.7 /100 | #68 | Exceptional 6.3% |
| Immigrants | Hong Kong | 97.5 /100 | #69 | Exceptional 6.3% |
| Immigrants | Malaysia | 97.5 /100 | #70 | Exceptional 6.3% |
| Immigrants | France | 97.4 /100 | #71 | Exceptional 6.3% |
| Scandinavians | 97.4 /100 | #72 | Exceptional 6.3% |
Demographics Similar to Alaskan Athabascans by Unemployment Among Ages 25 to 29 years
In terms of unemployment among ages 25 to 29 years, the demographic groups most similar to Alaskan Athabascans are Yuman (11.0%, a difference of 2.0%), Puerto Rican (11.1%, a difference of 3.1%), Pueblo (10.4%, a difference of 3.4%), Lumbee (11.2%, a difference of 4.2%), and Menominee (11.3%, a difference of 4.5%).
| Demographics | Rating | Rank | Unemployment Among Ages 25 to 29 years |
| Shoshone | 0.0 /100 | #326 | Tragic 9.2% |
| Colville | 0.0 /100 | #327 | Tragic 9.2% |
| Apache | 0.0 /100 | #328 | Tragic 9.5% |
| Aleuts | 0.0 /100 | #329 | Tragic 9.7% |
| Natives/Alaskans | 0.0 /100 | #330 | Tragic 9.8% |
| Alaska Natives | 0.0 /100 | #331 | Tragic 10.2% |
| Pueblo | 0.0 /100 | #332 | Tragic 10.4% |
| Alaskan Athabascans | 0.0 /100 | #333 | Tragic 10.8% |
| Yuman | 0.0 /100 | #334 | Tragic 11.0% |
| Puerto Ricans | 0.0 /100 | #335 | Tragic 11.1% |
| Lumbee | 0.0 /100 | #336 | Tragic 11.2% |
| Menominee | 0.0 /100 | #337 | Tragic 11.3% |
| Sioux | 0.0 /100 | #338 | Tragic 11.7% |
| Pima | 0.0 /100 | #339 | Tragic 11.8% |
| Cheyenne | 0.0 /100 | #340 | Tragic 11.8% |