Immigrants from Latvia vs Hawaiian Unemployment Among Ages 30 to 34 years

COMPARE

Immigrants from Latvia
Race
Ancestry
AfghanAfricanAlaska NativeAlaskan AthabascanAlbanianAleutAlsatianAmericanApacheArabArapahoArgentineanArmenianAssyrian/Chaldean/SyriacAustralianAustrianBahamianBangladeshiBarbadianBasqueBelgianBelizeanBermudanBhutaneseBlackfeetBolivianBrazilianBritishBritish West IndianBulgarianBurmeseCajunCambodianCanadianCape VerdeanCarpatho RusynCelticCentral AmericanCentral American IndianCherokeeCheyenneChickasawChileanChineseChippewaChoctawColombianColvilleComancheCosta RicanCreeCreekCroatianCrowCubanCypriotCzechCzechoslovakianDanishDelawareDominicanDutchDutch West IndianEastern EuropeanEcuadorianEgyptianEnglishEstonianEthiopianEuropeanFijianFilipinoFinnishFrenchFrench American IndianFrench CanadianGermanGerman RussianGhanaianGreekGuamanian/ChamorroGuatemalanGuyaneseHaitianHmongHonduranHopiHoumaHungarianIcelanderIndian (Asian)IndonesianInupiatIranianIraqiIrishIroquoisIsraeliItalianJamaicanJapaneseJordanianKenyanKiowaKoreanLaotianLatvianLebaneseLiberianLithuanianLumbeeLuxembourgerMacedonianMalaysianMalteseMarshalleseMenomineeMexicanMexican American IndianMongolianMoroccanNative HawaiianNavajoNepaleseNew ZealanderNicaraguanNigerianNorthern EuropeanNorwegianOkinawanOsageOttawaPaiutePakistaniPalestinianPanamanianParaguayanPennsylvania GermanPeruvianPimaPolishPortuguesePotawatomiPuebloPuerto RicanPuget Sound SalishRomanianRussianSalvadoranSamoanScandinavianScotch-IrishScottishSeminoleSenegaleseSerbianShoshoneSierra LeoneanSiouxSlavicSlovakSloveneSomaliSouth AfricanSouth AmericanSouth American IndianSoviet UnionSpaniardSpanishSpanish AmericanSpanish American IndianSri LankanSubsaharan AfricanSudaneseSwedishSwissSyrianTaiwaneseThaiTlingit-HaidaTohono O'OdhamTonganTrinidadian and TobagonianTsimshianTurkishU.S. Virgin IslanderUgandanUkrainianUruguayanUteVenezuelanVietnameseWelshWest IndianYakamaYaquiYugoslavianYumanYup'ikZimbabwean
Immigration
NonimmigrantsImmigrantsAfghanistanAfricaAlbaniaArgentinaArmeniaAsiaAustraliaAustriaBahamasBangladeshBarbadosBelarusBelgiumBelizeBoliviaBosnia and HerzegovinaBrazilBulgariaBurma/MyanmarCabo VerdeCambodiaCameroonCanadaCaribbeanCentral AmericaChileChinaColombiaCongoCosta RicaCroatiaCubaCzechoslovakiaDenmarkDominicaDominican RepublicEastern AfricaEastern AsiaEastern EuropeEcuadorEgyptEl SalvadorEnglandEritreaEthiopiaEuropeFijiFranceGermanyGhanaGreeceGrenadaGuatemalaGuyanaHaitiHondurasHong KongHungaryIndiaIndonesiaIranIraqIrelandIsraelItalyJamaicaJapanJordanKazakhstanKenyaKoreaKuwaitLaosLatin AmericaLatviaLebanonLiberiaLithuaniaMalaysiaMexicoMicronesiaMiddle AfricaMoldovaMoroccoNepalNetherlandsNicaraguaNigeriaNorth AmericaNorth MacedoniaNorthern AfricaNorthern EuropeNorwayOceaniaPakistanPanamaPeruPhilippinesPolandPortugalRomaniaRussiaSaudi ArabiaScotlandSenegalSerbiaSierra LeoneSingaporeSomaliaSouth AfricaSouth AmericaSouth Central AsiaSouth Eastern AsiaSouthern EuropeSpainSri LankaSt. Vincent and the GrenadinesSudanSwedenSwitzerlandSyriaTaiwanThailandTrinidad and TobagoTurkeyUgandaUkraineUruguayUzbekistanVenezuelaVietnamWest IndiesWestern AfricaWestern AsiaWestern EuropeYemenZaireZimbabweAzores
Hawaiian
Race
Ancestry
AfghanAfricanAlaska NativeAlaskan AthabascanAlbanianAleutAlsatianAmericanApacheArabArapahoArgentineanArmenianAssyrian/Chaldean/SyriacAustralianAustrianBahamianBangladeshiBarbadianBasqueBelgianBelizeanBermudanBhutaneseBlackfeetBolivianBrazilianBritishBritish West IndianBulgarianBurmeseCajunCambodianCanadianCape VerdeanCarpatho RusynCelticCentral AmericanCentral American IndianCherokeeCheyenneChickasawChileanChineseChippewaChoctawColombianColvilleComancheCosta RicanCreeCreekCroatianCrowCubanCypriotCzechCzechoslovakianDanishDelawareDominicanDutchDutch West IndianEastern EuropeanEcuadorianEgyptianEnglishEstonianEthiopianEuropeanFijianFilipinoFinnishFrenchFrench American IndianFrench CanadianGermanGerman RussianGhanaianGreekGuamanian/ChamorroGuatemalanGuyaneseHaitianHmongHonduranHopiHoumaHungarianIcelanderIndian (Asian)IndonesianInupiatIranianIraqiIrishIroquoisIsraeliItalianJamaicanJapaneseJordanianKenyanKiowaKoreanLaotianLatvianLebaneseLiberianLithuanianLumbeeLuxembourgerMacedonianMalaysianMalteseMarshalleseMenomineeMexicanMexican American IndianMongolianMoroccanNative HawaiianNavajoNepaleseNew ZealanderNicaraguanNigerianNorthern EuropeanNorwegianOkinawanOsageOttawaPaiutePakistaniPalestinianPanamanianParaguayanPennsylvania GermanPeruvianPimaPolishPortuguesePotawatomiPuebloPuerto RicanPuget Sound SalishRomanianRussianSalvadoranSamoanScandinavianScotch-IrishScottishSeminoleSenegaleseSerbianShoshoneSierra LeoneanSiouxSlavicSlovakSloveneSomaliSouth AfricanSouth AmericanSouth American IndianSoviet UnionSpaniardSpanishSpanish AmericanSpanish American IndianSri LankanSubsaharan AfricanSudaneseSwedishSwissSyrianTaiwaneseThaiTlingit-HaidaTohono O'OdhamTonganTrinidadian and TobagonianTsimshianTurkishU.S. Virgin IslanderUgandanUkrainianUruguayanUteVenezuelanVietnameseWelshWest IndianYakamaYaquiYugoslavianYumanYup'ikZimbabwean
Immigration
NonimmigrantsImmigrantsAfghanistanAfricaAlbaniaArgentinaArmeniaAsiaAustraliaAustriaBahamasBangladeshBarbadosBelarusBelgiumBelizeBoliviaBosnia and HerzegovinaBrazilBulgariaBurma/MyanmarCabo VerdeCambodiaCameroonCanadaCaribbeanCentral AmericaChileChinaColombiaCongoCosta RicaCroatiaCubaCzechoslovakiaDenmarkDominicaDominican RepublicEastern AfricaEastern AsiaEastern EuropeEcuadorEgyptEl SalvadorEnglandEritreaEthiopiaEuropeFijiFranceGermanyGhanaGreeceGrenadaGuatemalaGuyanaHaitiHondurasHong KongHungaryIndiaIndonesiaIranIraqIrelandIsraelItalyJamaicaJapanJordanKazakhstanKenyaKoreaKuwaitLaosLatin AmericaLebanonLiberiaLithuaniaMalaysiaMexicoMicronesiaMiddle AfricaMoldovaMoroccoNepalNetherlandsNicaraguaNigeriaNorth AmericaNorth MacedoniaNorthern AfricaNorthern EuropeNorwayOceaniaPakistanPanamaPeruPhilippinesPolandPortugalRomaniaRussiaSaudi ArabiaScotlandSenegalSerbiaSierra LeoneSingaporeSomaliaSouth AfricaSouth AmericaSouth Central AsiaSouth Eastern AsiaSouthern EuropeSpainSri LankaSt. Vincent and the GrenadinesSudanSwedenSwitzerlandSyriaTaiwanThailandTrinidad and TobagoTurkeyUgandaUkraineUruguayUzbekistanVenezuelaVietnamWest IndiesWestern AfricaWestern AsiaWestern EuropeYemenZaireZimbabweAzores
Unemployment Among Ages 30 to 34 years
Income
Poverty
Unemployment
Labor Participation
Family Structure
Vehicle Availability
Education Level
Disability

Unemployment Among Ages 30 to 34 years Comparison

Immigrants from Latvia

Hawaiians

Exceptional
Tragic
5.2%
UNEMPLOYMENT AMONG AGES 30 TO 34 YEARS
94.2/ 100
METRIC RATING
82nd/ 347
METRIC RANK
5.9%
UNEMPLOYMENT AMONG AGES 30 TO 34 YEARS
1.2/ 100
METRIC RATING
230th/ 347
METRIC RANK

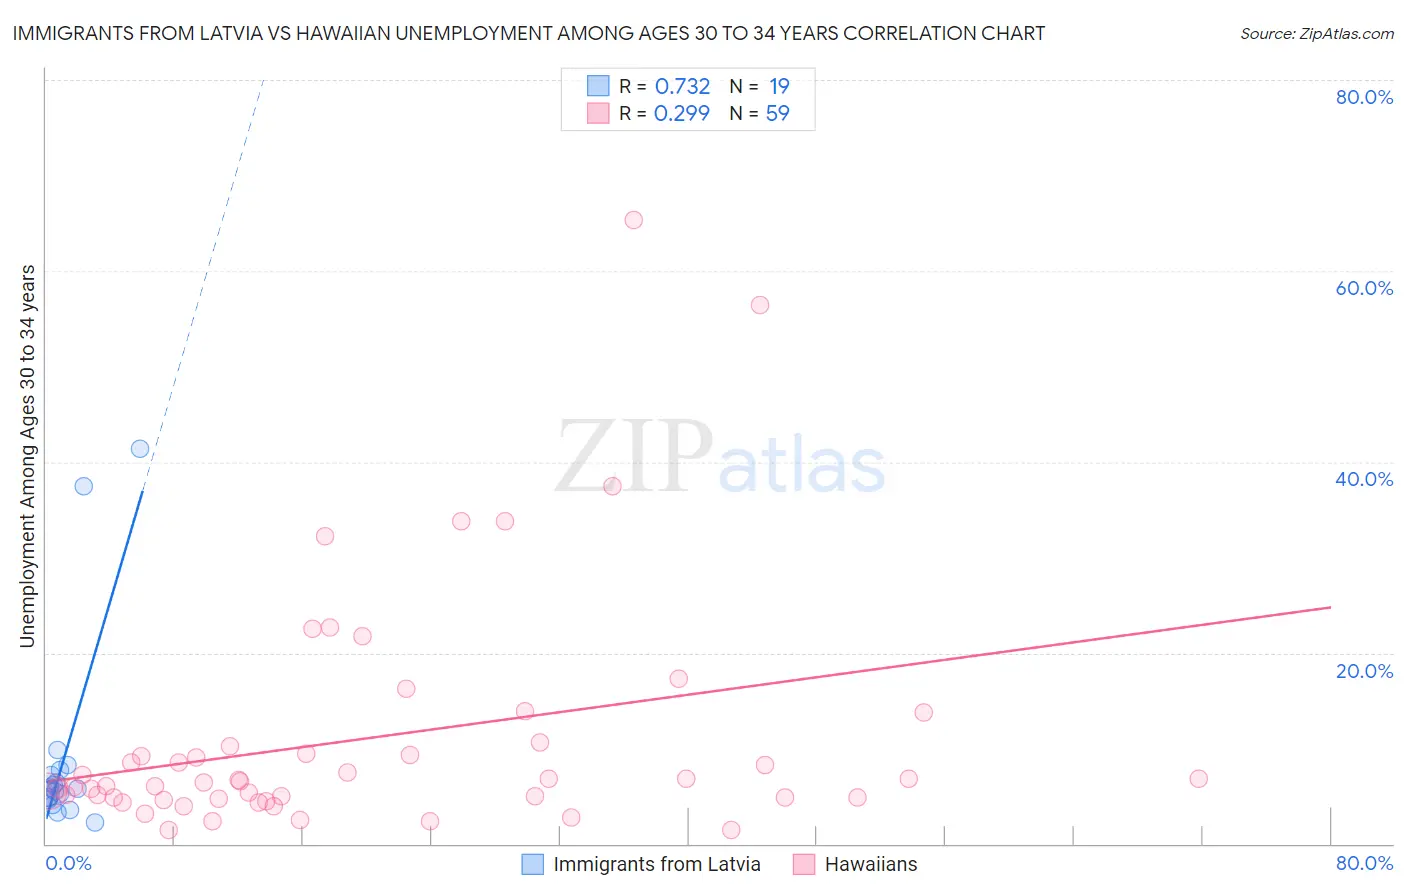
Immigrants from Latvia vs Hawaiian Unemployment Among Ages 30 to 34 years Correlation Chart

The statistical analysis conducted on geographies consisting of 111,503,668 people shows a strong positive correlation between the proportion of Immigrants from Latvia and unemployment rate among population between the ages 30 and 34 in the United States with a correlation coefficient (R) of 0.732 and weighted average of 5.2%. Similarly, the statistical analysis conducted on geographies consisting of 312,816,789 people shows a weak positive correlation between the proportion of Hawaiians and unemployment rate among population between the ages 30 and 34 in the United States with a correlation coefficient (R) of 0.299 and weighted average of 5.9%, a difference of 13.1%.
Immigrants from Latvia vs Hawaiian Unemployment Among Ages 30 to 34 years

Unemployment Among Ages 30 to 34 years Correlation Summary

MeasurementImmigrants from LatviaHawaiian
Minimum2.2%1.4%
Maximum41.4%65.4%
Range39.2%64.0%
Mean9.2%11.1%
Median5.7%6.6%
Interquartile 25% (IQ1)4.6%4.9%
Interquartile 75% (IQ3)7.8%10.2%
Interquartile Range (IQR)3.1%5.4%
Standard Deviation (Sample)10.8%12.6%
Standard Deviation (Population)10.5%12.5%

Similar Demographics by Unemployment Among Ages 30 to 34 years

Demographics Similar to Immigrants from Latvia by Unemployment Among Ages 30 to 34 years

In terms of unemployment among ages 30 to 34 years, the demographic groups most similar to Immigrants from Latvia are Immigrants from Korea (5.2%, a difference of 0.030%), Chilean (5.2%, a difference of 0.070%), Immigrants from Uganda (5.2%, a difference of 0.080%), Immigrants from Egypt (5.2%, a difference of 0.11%), and Immigrants from Indonesia (5.2%, a difference of 0.18%).
DemographicsRating | RankUnemployment Among Ages 30 to 34 years
Iranians
96.0
/100
|
#75
Exceptional
5.2%
Scandinavians
95.6
/100
|
#76
Exceptional
5.2%
Uruguayans
95.4
/100
|
#77
Exceptional
5.2%
Indonesians
95.1
/100
|
#78
Exceptional
5.2%
Immigrants | Lithuania
95.0
/100
|
#79
Exceptional
5.2%
Immigrants | Indonesia
94.7
/100
|
#80
Exceptional
5.2%
Chileans
94.4
/100
|
#81
Exceptional
5.2%
Immigrants | Latvia
94.2
/100
|
#82
Exceptional
5.2%
Immigrants | Korea
94.1
/100
|
#83
Exceptional
5.2%
Immigrants | Uganda
94.0
/100
|
#84
Exceptional
5.2%
Immigrants | Egypt
93.9
/100
|
#85
Exceptional
5.2%
Immigrants | Australia
93.5
/100
|
#86
Exceptional
5.2%
Bhutanese
93.5
/100
|
#87
Exceptional
5.2%
Immigrants | Kenya
93.3
/100
|
#88
Exceptional
5.2%
Immigrants | Sweden
93.3
/100
|
#89
Exceptional
5.2%

Demographics Similar to Hawaiians by Unemployment Among Ages 30 to 34 years

In terms of unemployment among ages 30 to 34 years, the demographic groups most similar to Hawaiians are Japanese (5.9%, a difference of 0.13%), Iroquois (5.9%, a difference of 0.26%), Immigrants from Uzbekistan (5.9%, a difference of 0.32%), Immigrants from Bahamas (5.8%, a difference of 0.64%), and Nepalese (5.9%, a difference of 0.64%).
DemographicsRating | RankUnemployment Among Ages 30 to 34 years
Bermudans
2.7
/100
|
#223
Tragic
5.8%
Slovaks
2.5
/100
|
#224
Tragic
5.8%
Samoans
2.5
/100
|
#225
Tragic
5.8%
Liberians
2.3
/100
|
#226
Tragic
5.8%
Spanish
1.8
/100
|
#227
Tragic
5.8%
Immigrants | Bahamas
1.8
/100
|
#228
Tragic
5.8%
Immigrants | Uzbekistan
1.5
/100
|
#229
Tragic
5.9%
Hawaiians
1.2
/100
|
#230
Tragic
5.9%
Japanese
1.1
/100
|
#231
Tragic
5.9%
Iroquois
1.0
/100
|
#232
Tragic
5.9%
Nepalese
0.8
/100
|
#233
Tragic
5.9%
Portuguese
0.8
/100
|
#234
Tragic
5.9%
Yaqui
0.7
/100
|
#235
Tragic
5.9%
Native Hawaiians
0.7
/100
|
#236
Tragic
5.9%
Central Americans
0.6
/100
|
#237
Tragic
5.9%