Immigrants from Latvia vs Finnish Female Unemployment
COMPARE
Immigrants from Latvia
Finnish
Female Unemployment
Female Unemployment Comparison
Immigrants from Latvia
Finns
5.1%
FEMALE UNEMPLOYMENT
84.6/ 100
METRIC RATING
135th/ 347
METRIC RANK
4.6%
FEMALE UNEMPLOYMENT
100.0/ 100
METRIC RATING
14th/ 347
METRIC RANK
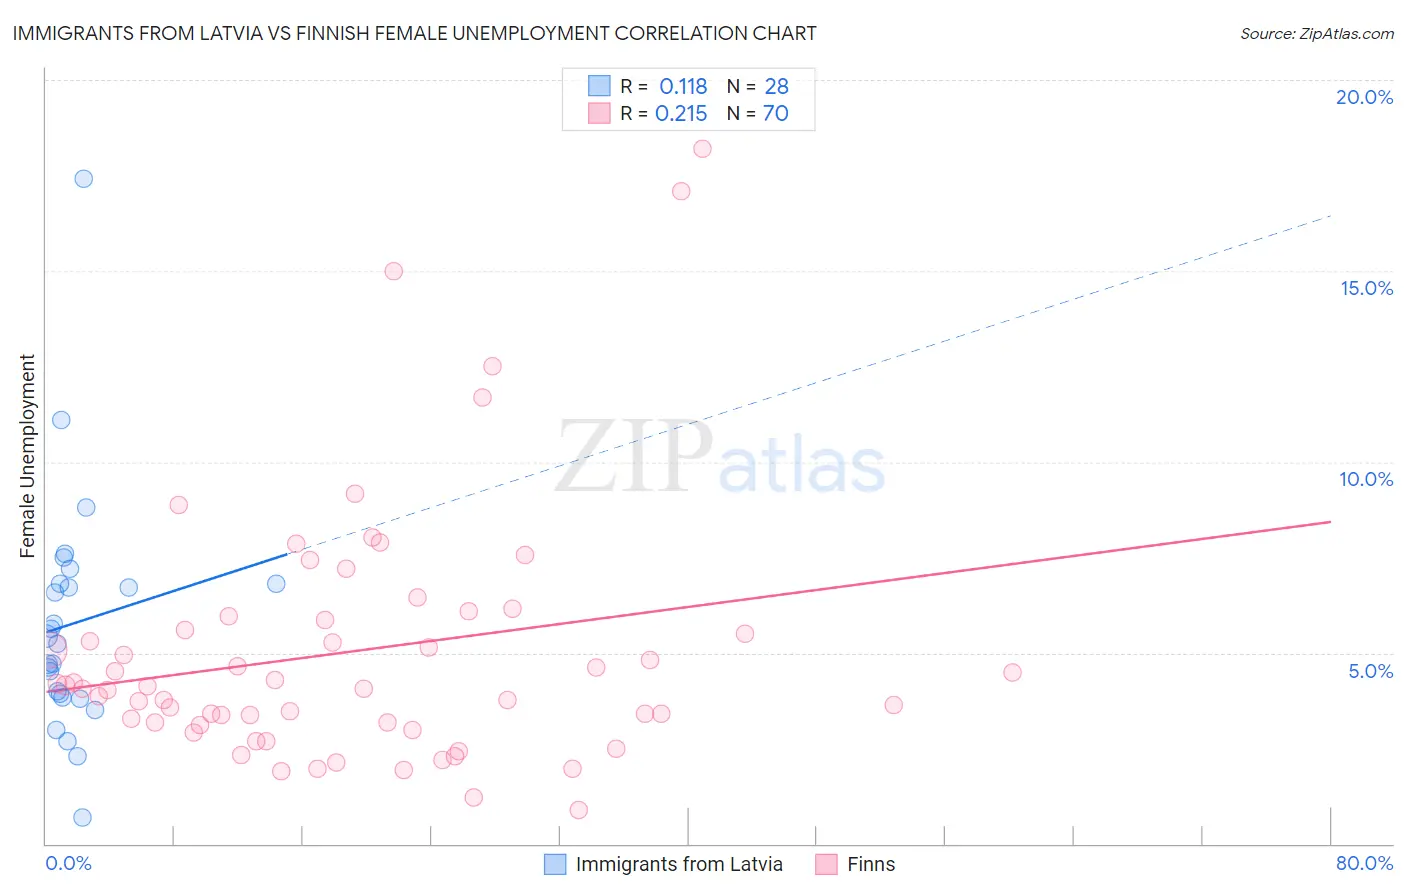
Immigrants from Latvia vs Finnish Female Unemployment Correlation Chart
The statistical analysis conducted on geographies consisting of 113,613,116 people shows a poor positive correlation between the proportion of Immigrants from Latvia and unemploymnet rate among females in the United States with a correlation coefficient (R) of 0.118 and weighted average of 5.1%. Similarly, the statistical analysis conducted on geographies consisting of 401,070,094 people shows a weak positive correlation between the proportion of Finns and unemploymnet rate among females in the United States with a correlation coefficient (R) of 0.215 and weighted average of 4.6%, a difference of 10.7%.
Female Unemployment Correlation Summary
| Measurement | Immigrants from Latvia | Finnish |
| Minimum | 0.70% | 0.90% |
| Maximum | 17.4% | 18.2% |
| Range | 16.7% | 17.3% |
| Mean | 5.8% | 5.0% |
| Median | 5.3% | 4.1% |
| Interquartile 25% (IQ1) | 3.9% | 3.2% |
| Interquartile 75% (IQ3) | 6.8% | 5.9% |
| Interquartile Range (IQR) | 2.9% | 2.7% |
| Standard Deviation (Sample) | 3.1% | 3.4% |
| Standard Deviation (Population) | 3.1% | 3.3% |
Similar Demographics by Female Unemployment
Demographics Similar to Immigrants from Latvia by Female Unemployment
In terms of female unemployment, the demographic groups most similar to Immigrants from Latvia are Immigrants from Eritrea (5.1%, a difference of 0.0%), Immigrants from Hong Kong (5.1%, a difference of 0.030%), Immigrants from Sri Lanka (5.1%, a difference of 0.050%), Indian (Asian) (5.1%, a difference of 0.050%), and Pakistani (5.1%, a difference of 0.090%).
| Demographics | Rating | Rank | Female Unemployment |
| Chileans | 85.8 /100 | #128 | Excellent 5.1% |
| Ethiopians | 85.7 /100 | #129 | Excellent 5.1% |
| Maltese | 85.5 /100 | #130 | Excellent 5.1% |
| Immigrants | Ethiopia | 85.4 /100 | #131 | Excellent 5.1% |
| Immigrants | Sri Lanka | 85.0 /100 | #132 | Excellent 5.1% |
| Immigrants | Hong Kong | 84.8 /100 | #133 | Excellent 5.1% |
| Immigrants | Eritrea | 84.6 /100 | #134 | Excellent 5.1% |
| Immigrants | Latvia | 84.6 /100 | #135 | Excellent 5.1% |
| Indians (Asian) | 84.2 /100 | #136 | Excellent 5.1% |
| Pakistanis | 83.8 /100 | #137 | Excellent 5.1% |
| Chickasaw | 83.2 /100 | #138 | Excellent 5.1% |
| Immigrants | Eastern Asia | 83.0 /100 | #139 | Excellent 5.1% |
| Immigrants | France | 82.7 /100 | #140 | Excellent 5.1% |
| Immigrants | Eastern Europe | 81.5 /100 | #141 | Excellent 5.1% |
| Palestinians | 80.8 /100 | #142 | Excellent 5.1% |
Demographics Similar to Finns by Female Unemployment
In terms of female unemployment, the demographic groups most similar to Finns are English (4.6%, a difference of 0.20%), Belgian (4.6%, a difference of 0.59%), Dutch (4.6%, a difference of 0.75%), Carpatho Rusyn (4.7%, a difference of 1.1%), and Croatian (4.7%, a difference of 1.1%).
| Demographics | Rating | Rank | Female Unemployment |
| Chinese | 100.0 /100 | #7 | Exceptional 4.5% |
| Germans | 100.0 /100 | #8 | Exceptional 4.5% |
| Slovenes | 100.0 /100 | #9 | Exceptional 4.5% |
| Swiss | 100.0 /100 | #10 | Exceptional 4.6% |
| Scandinavians | 100.0 /100 | #11 | Exceptional 4.6% |
| Dutch | 100.0 /100 | #12 | Exceptional 4.6% |
| Belgians | 100.0 /100 | #13 | Exceptional 4.6% |
| Finns | 100.0 /100 | #14 | Exceptional 4.6% |
| English | 100.0 /100 | #15 | Exceptional 4.6% |
| Carpatho Rusyns | 99.9 /100 | #16 | Exceptional 4.7% |
| Croatians | 99.9 /100 | #17 | Exceptional 4.7% |
| Latvians | 99.9 /100 | #18 | Exceptional 4.7% |
| Poles | 99.9 /100 | #19 | Exceptional 4.7% |
| Bulgarians | 99.9 /100 | #20 | Exceptional 4.7% |
| Fijians | 99.9 /100 | #21 | Exceptional 4.7% |