Immigrants from Latin America vs Venezuelan Unemployment Among Seniors over 65 years

COMPARE

Immigrants from Latin America
Race
Ancestry
AfghanAfricanAlaska NativeAlaskan AthabascanAlbanianAleutAlsatianAmericanApacheArabArapahoArgentineanArmenianAssyrian/Chaldean/SyriacAustralianAustrianBahamianBangladeshiBarbadianBasqueBelgianBelizeanBermudanBhutaneseBlackfeetBolivianBrazilianBritishBritish West IndianBulgarianBurmeseCajunCambodianCanadianCape VerdeanCarpatho RusynCelticCentral AmericanCentral American IndianCherokeeCheyenneChickasawChileanChineseChippewaChoctawColombianColvilleComancheCosta RicanCreeCreekCroatianCrowCubanCypriotCzechCzechoslovakianDanishDelawareDominicanDutchDutch West IndianEastern EuropeanEcuadorianEgyptianEnglishEstonianEthiopianEuropeanFijianFilipinoFinnishFrenchFrench American IndianFrench CanadianGermanGerman RussianGhanaianGreekGuamanian/ChamorroGuatemalanGuyaneseHaitianHmongHonduranHopiHoumaHungarianIcelanderIndian (Asian)IndonesianInupiatIranianIraqiIrishIroquoisIsraeliItalianJamaicanJapaneseJordanianKenyanKiowaKoreanLaotianLatvianLebaneseLiberianLithuanianLumbeeLuxembourgerMacedonianMalaysianMalteseMarshalleseMenomineeMexicanMexican American IndianMongolianMoroccanNative HawaiianNavajoNepaleseNew ZealanderNicaraguanNigerianNorthern EuropeanNorwegianOkinawanOsageOttawaPaiutePakistaniPalestinianPanamanianParaguayanPennsylvania GermanPeruvianPimaPolishPortuguesePotawatomiPuebloPuerto RicanPuget Sound SalishRomanianRussianSalvadoranSamoanScandinavianScotch-IrishScottishSeminoleSenegaleseSerbianShoshoneSierra LeoneanSiouxSlavicSlovakSloveneSomaliSouth AfricanSouth AmericanSouth American IndianSoviet UnionSpaniardSpanishSpanish AmericanSpanish American IndianSri LankanSubsaharan AfricanSudaneseSwedishSwissSyrianTaiwaneseThaiTlingit-HaidaTohono O'OdhamTonganTrinidadian and TobagonianTsimshianTurkishU.S. Virgin IslanderUgandanUkrainianUruguayanUteVietnameseWelshWest IndianYakamaYaquiYugoslavianYumanYup'ikZimbabwean
Immigration
NonimmigrantsImmigrantsAfghanistanAfricaAlbaniaArgentinaArmeniaAsiaAustraliaAustriaBahamasBangladeshBarbadosBelarusBelgiumBelizeBoliviaBosnia and HerzegovinaBrazilBulgariaBurma/MyanmarCabo VerdeCambodiaCameroonCanadaCaribbeanCentral AmericaChileChinaColombiaCongoCosta RicaCroatiaCubaCzechoslovakiaDenmarkDominicaDominican RepublicEastern AfricaEastern AsiaEastern EuropeEcuadorEgyptEl SalvadorEnglandEritreaEthiopiaEuropeFijiFranceGermanyGhanaGreeceGrenadaGuatemalaGuyanaHaitiHondurasHong KongHungaryIndiaIndonesiaIranIraqIrelandIsraelItalyJamaicaJapanJordanKazakhstanKenyaKoreaKuwaitLaosLatin AmericaLatviaLebanonLiberiaLithuaniaMalaysiaMexicoMicronesiaMiddle AfricaMoldovaMoroccoNepalNetherlandsNicaraguaNigeriaNorth AmericaNorth MacedoniaNorthern AfricaNorthern EuropeNorwayOceaniaPakistanPanamaPeruPhilippinesPolandPortugalRomaniaRussiaSaudi ArabiaScotlandSenegalSerbiaSierra LeoneSingaporeSomaliaSouth AfricaSouth AmericaSouth Central AsiaSouth Eastern AsiaSouthern EuropeSpainSri LankaSt. Vincent and the GrenadinesSudanSwedenSwitzerlandSyriaTaiwanThailandTrinidad and TobagoTurkeyUgandaUkraineUruguayUzbekistanVenezuelaVietnamWest IndiesWestern AfricaWestern AsiaWestern EuropeYemenZaireZimbabweAzores
Venezuelan
Race
Ancestry
AfghanAfricanAlaska NativeAlaskan AthabascanAlbanianAleutAlsatianAmericanApacheArabArapahoArgentineanArmenianAssyrian/Chaldean/SyriacAustralianAustrianBahamianBangladeshiBarbadianBasqueBelgianBelizeanBermudanBhutaneseBlackfeetBolivianBrazilianBritishBritish West IndianBulgarianBurmeseCajunCambodianCanadianCape VerdeanCarpatho RusynCelticCentral AmericanCentral American IndianCherokeeCheyenneChickasawChileanChineseChippewaChoctawColombianColvilleComancheCosta RicanCreeCreekCroatianCrowCubanCypriotCzechCzechoslovakianDanishDelawareDominicanDutchDutch West IndianEastern EuropeanEcuadorianEgyptianEnglishEstonianEthiopianEuropeanFijianFilipinoFinnishFrenchFrench American IndianFrench CanadianGermanGerman RussianGhanaianGreekGuamanian/ChamorroGuatemalanGuyaneseHaitianHmongHonduranHopiHoumaHungarianIcelanderIndian (Asian)IndonesianInupiatIranianIraqiIrishIroquoisIsraeliItalianJamaicanJapaneseJordanianKenyanKiowaKoreanLaotianLatvianLebaneseLiberianLithuanianLumbeeLuxembourgerMacedonianMalaysianMalteseMarshalleseMenomineeMexicanMexican American IndianMongolianMoroccanNative HawaiianNavajoNepaleseNew ZealanderNicaraguanNigerianNorthern EuropeanNorwegianOkinawanOsageOttawaPaiutePakistaniPalestinianPanamanianParaguayanPennsylvania GermanPeruvianPimaPolishPortuguesePotawatomiPuebloPuerto RicanPuget Sound SalishRomanianRussianSalvadoranSamoanScandinavianScotch-IrishScottishSeminoleSenegaleseSerbianShoshoneSierra LeoneanSiouxSlavicSlovakSloveneSomaliSouth AfricanSouth AmericanSouth American IndianSoviet UnionSpaniardSpanishSpanish AmericanSpanish American IndianSri LankanSubsaharan AfricanSudaneseSwedishSwissSyrianTaiwaneseThaiTlingit-HaidaTohono O'OdhamTonganTrinidadian and TobagonianTsimshianTurkishU.S. Virgin IslanderUgandanUkrainianUruguayanUteVenezuelanVietnameseWelshWest IndianYakamaYaquiYugoslavianYumanYup'ikZimbabwean
Immigration
NonimmigrantsImmigrantsAfghanistanAfricaAlbaniaArgentinaArmeniaAsiaAustraliaAustriaBahamasBangladeshBarbadosBelarusBelgiumBelizeBoliviaBosnia and HerzegovinaBrazilBulgariaBurma/MyanmarCabo VerdeCambodiaCameroonCanadaCaribbeanCentral AmericaChileChinaColombiaCongoCosta RicaCroatiaCubaCzechoslovakiaDenmarkDominicaDominican RepublicEastern AfricaEastern AsiaEastern EuropeEcuadorEgyptEl SalvadorEnglandEritreaEthiopiaEuropeFijiFranceGermanyGhanaGreeceGrenadaGuatemalaGuyanaHaitiHondurasHong KongHungaryIndiaIndonesiaIranIraqIrelandIsraelItalyJamaicaJapanJordanKazakhstanKenyaKoreaKuwaitLaosLatviaLebanonLiberiaLithuaniaMalaysiaMexicoMicronesiaMiddle AfricaMoldovaMoroccoNepalNetherlandsNicaraguaNigeriaNorth AmericaNorth MacedoniaNorthern AfricaNorthern EuropeNorwayOceaniaPakistanPanamaPeruPhilippinesPolandPortugalRomaniaRussiaSaudi ArabiaScotlandSenegalSerbiaSierra LeoneSingaporeSomaliaSouth AfricaSouth AmericaSouth Central AsiaSouth Eastern AsiaSouthern EuropeSpainSri LankaSt. Vincent and the GrenadinesSudanSwedenSwitzerlandSyriaTaiwanThailandTrinidad and TobagoTurkeyUgandaUkraineUruguayUzbekistanVenezuelaVietnamWest IndiesWestern AfricaWestern AsiaWestern EuropeYemenZaireZimbabweAzores
Unemployment Among Seniors over 65 years
Income
Poverty
Unemployment
Labor Participation
Family Structure
Vehicle Availability
Education Level
Disability

Unemployment Among Seniors over 65 years Comparison

Immigrants from Latin America

Venezuelans

Tragic
Tragic
5.6%
UNEMPLOYMENT AMONG SENIORS OVER 65 YEARS
0.0/ 100
METRIC RATING
303rd/ 347
METRIC RANK
5.5%
UNEMPLOYMENT AMONG SENIORS OVER 65 YEARS
0.0/ 100
METRIC RATING
287th/ 347
METRIC RANK

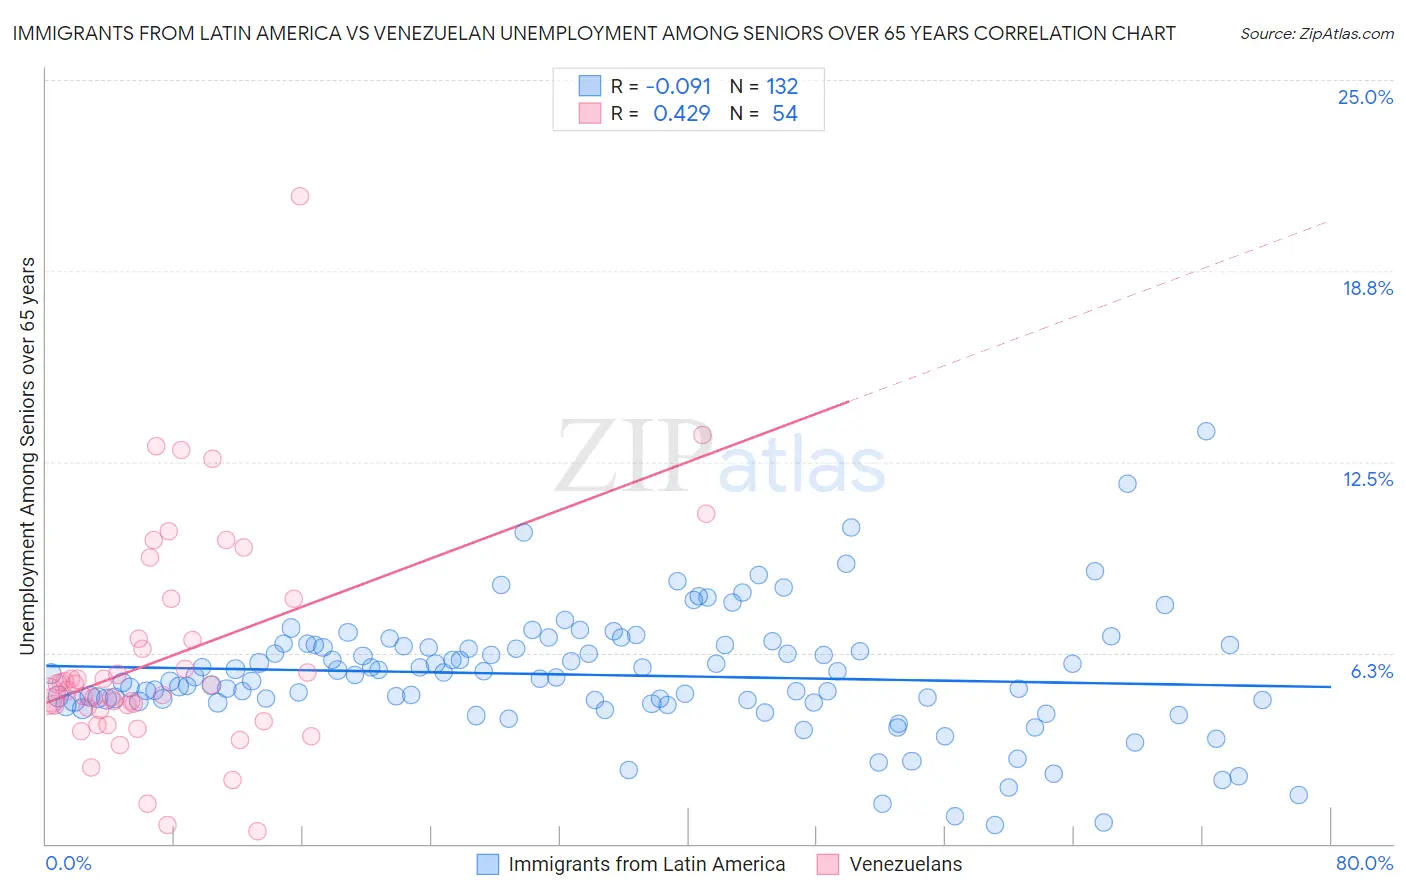
Immigrants from Latin America vs Venezuelan Unemployment Among Seniors over 65 years Correlation Chart

The statistical analysis conducted on geographies consisting of 459,196,577 people shows a slight negative correlation between the proportion of Immigrants from Latin America and unemployment rate amomg seniors over the age of 65 in the United States with a correlation coefficient (R) of -0.091 and weighted average of 5.6%. Similarly, the statistical analysis conducted on geographies consisting of 283,087,551 people shows a moderate positive correlation between the proportion of Venezuelans and unemployment rate amomg seniors over the age of 65 in the United States with a correlation coefficient (R) of 0.429 and weighted average of 5.5%, a difference of 1.5%.
Immigrants from Latin America vs Venezuelan Unemployment Among Seniors over 65 years

Unemployment Among Seniors over 65 years Correlation Summary

MeasurementImmigrants from Latin AmericaVenezuelan
Minimum0.60%0.40%
Maximum13.5%21.2%
Range12.9%20.8%
Mean5.5%6.1%
Median5.5%5.1%
Interquartile 25% (IQ1)4.7%4.4%
Interquartile 75% (IQ3)6.5%6.7%
Interquartile Range (IQR)1.8%2.3%
Standard Deviation (Sample)2.0%3.7%
Standard Deviation (Population)2.0%3.6%

Demographics Similar to Immigrants from Latin America and Venezuelans by Unemployment Among Seniors over 65 years

In terms of unemployment among seniors over 65 years, the demographic groups most similar to Immigrants from Latin America are Liberian (5.6%, a difference of 0.070%), Guatemalan (5.6%, a difference of 0.090%), Mexican (5.6%, a difference of 0.24%), Hispanic or Latino (5.6%, a difference of 0.26%), and Zimbabwean (5.6%, a difference of 0.46%). Similarly, the demographic groups most similar to Venezuelans are U.S. Virgin Islander (5.5%, a difference of 0.0%), Immigrants from Barbados (5.5%, a difference of 0.030%), Immigrants from Cabo Verde (5.5%, a difference of 0.030%), Central American (5.5%, a difference of 0.050%), and Jamaican (5.5%, a difference of 0.45%).
DemographicsRating | RankUnemployment Among Seniors over 65 years
Central Americans
0.0
/100
|
#285
Tragic
5.5%
Immigrants | Barbados
0.0
/100
|
#286
Tragic
5.5%
Venezuelans
0.0
/100
|
#287
Tragic
5.5%
U.S. Virgin Islanders
0.0
/100
|
#288
Tragic
5.5%
Immigrants | Cabo Verde
0.0
/100
|
#289
Tragic
5.5%
Jamaicans
0.0
/100
|
#290
Tragic
5.5%
Blacks/African Americans
0.0
/100
|
#291
Tragic
5.5%
Belizeans
0.0
/100
|
#292
Tragic
5.5%
Immigrants | Venezuela
0.0
/100
|
#293
Tragic
5.5%
Armenians
0.0
/100
|
#294
Tragic
5.5%
Cheyenne
0.0
/100
|
#295
Tragic
5.5%
Cape Verdeans
0.0
/100
|
#296
Tragic
5.5%
Yaqui
0.0
/100
|
#297
Tragic
5.5%
Immigrants | West Indies
0.0
/100
|
#298
Tragic
5.6%
Guyanese
0.0
/100
|
#299
Tragic
5.6%
Zimbabweans
0.0
/100
|
#300
Tragic
5.6%
Hispanics or Latinos
0.0
/100
|
#301
Tragic
5.6%
Guatemalans
0.0
/100
|
#302
Tragic
5.6%
Immigrants | Latin America
0.0
/100
|
#303
Tragic
5.6%
Liberians
0.0
/100
|
#304
Tragic
5.6%
Mexicans
0.0
/100
|
#305
Tragic
5.6%