Immigrants from Latin America vs Ugandan Unemployment Among Ages 25 to 29 years
COMPARE
Immigrants from Latin America
Ugandan
Unemployment Among Ages 25 to 29 years
Unemployment Among Ages 25 to 29 years Comparison
Immigrants from Latin America
Ugandans
7.4%
UNEMPLOYMENT AMONG AGES 25 TO 29 YEARS
0.1/ 100
METRIC RATING
269th/ 347
METRIC RANK
6.8%
UNEMPLOYMENT AMONG AGES 25 TO 29 YEARS
19.8/ 100
METRIC RATING
206th/ 347
METRIC RANK
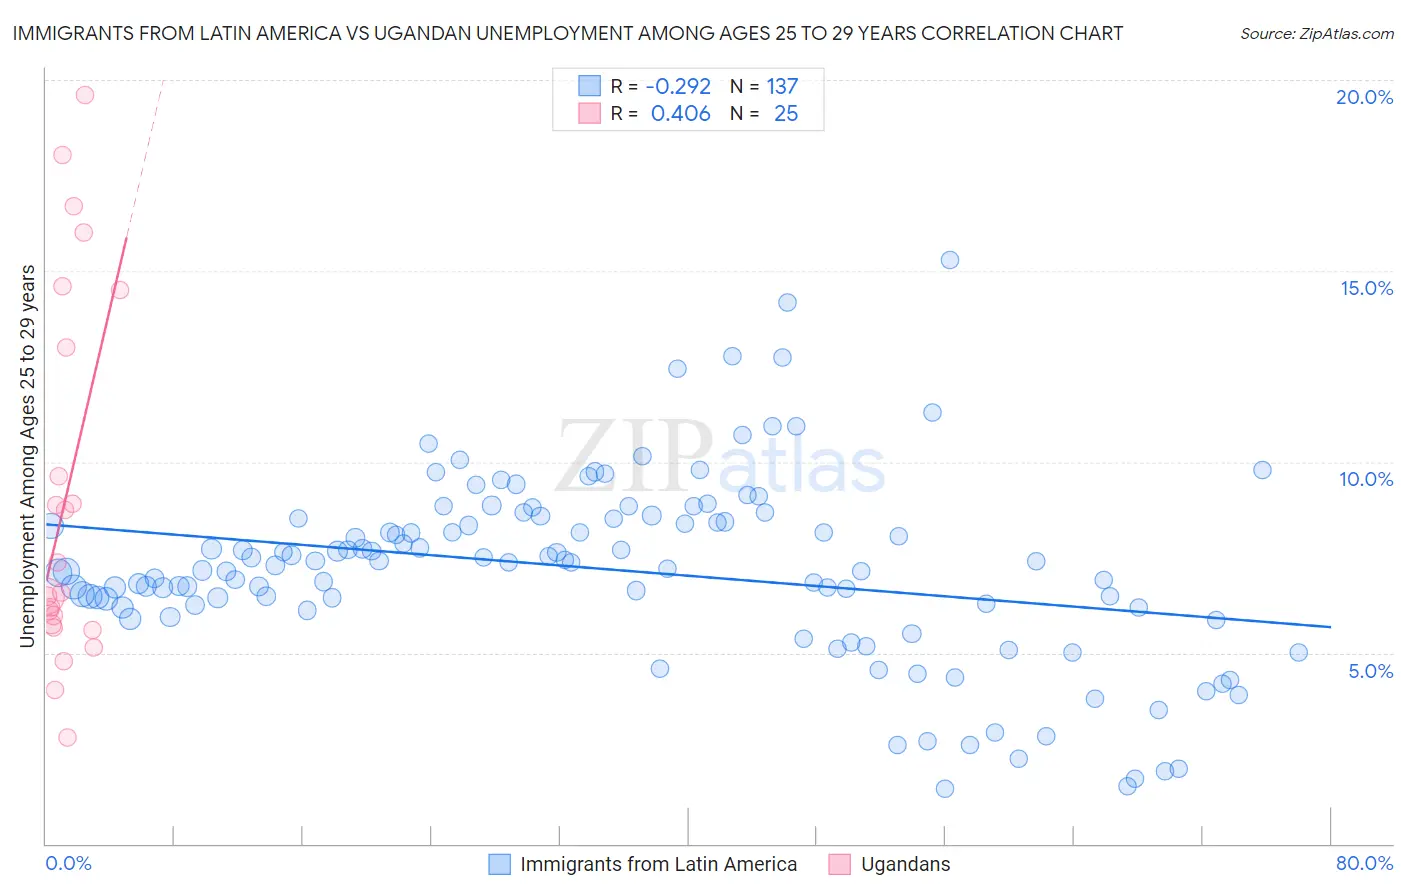
Immigrants from Latin America vs Ugandan Unemployment Among Ages 25 to 29 years Correlation Chart
The statistical analysis conducted on geographies consisting of 503,337,302 people shows a weak negative correlation between the proportion of Immigrants from Latin America and unemployment rate among population between the ages 25 and 29 in the United States with a correlation coefficient (R) of -0.292 and weighted average of 7.4%. Similarly, the statistical analysis conducted on geographies consisting of 93,124,159 people shows a moderate positive correlation between the proportion of Ugandans and unemployment rate among population between the ages 25 and 29 in the United States with a correlation coefficient (R) of 0.406 and weighted average of 6.8%, a difference of 9.2%.
Unemployment Among Ages 25 to 29 years Correlation Summary
| Measurement | Immigrants from Latin America | Ugandan |
| Minimum | 1.4% | 2.8% |
| Maximum | 15.3% | 19.6% |
| Range | 13.9% | 16.8% |
| Mean | 7.2% | 9.1% |
| Median | 7.4% | 6.6% |
| Interquartile 25% (IQ1) | 6.2% | 5.7% |
| Interquartile 75% (IQ3) | 8.5% | 13.8% |
| Interquartile Range (IQR) | 2.3% | 8.0% |
| Standard Deviation (Sample) | 2.4% | 4.8% |
| Standard Deviation (Population) | 2.4% | 4.7% |
Similar Demographics by Unemployment Among Ages 25 to 29 years
Demographics Similar to Immigrants from Latin America by Unemployment Among Ages 25 to 29 years
In terms of unemployment among ages 25 to 29 years, the demographic groups most similar to Immigrants from Latin America are Immigrants from Ecuador (7.4%, a difference of 0.060%), Pennsylvania German (7.4%, a difference of 0.080%), Paiute (7.4%, a difference of 0.15%), Immigrants from Fiji (7.4%, a difference of 0.29%), and Immigrants from Western Africa (7.4%, a difference of 0.35%).
| Demographics | Rating | Rank | Unemployment Among Ages 25 to 29 years |
| Ecuadorians | 0.1 /100 | #262 | Tragic 7.4% |
| Kiowa | 0.1 /100 | #263 | Tragic 7.4% |
| Immigrants | Western Africa | 0.1 /100 | #264 | Tragic 7.4% |
| Immigrants | Fiji | 0.1 /100 | #265 | Tragic 7.4% |
| Paiute | 0.1 /100 | #266 | Tragic 7.4% |
| Pennsylvania Germans | 0.1 /100 | #267 | Tragic 7.4% |
| Immigrants | Ecuador | 0.1 /100 | #268 | Tragic 7.4% |
| Immigrants | Latin America | 0.1 /100 | #269 | Tragic 7.4% |
| Bahamians | 0.0 /100 | #270 | Tragic 7.5% |
| Choctaw | 0.0 /100 | #271 | Tragic 7.5% |
| Immigrants | Bahamas | 0.0 /100 | #272 | Tragic 7.5% |
| Immigrants | Nigeria | 0.0 /100 | #273 | Tragic 7.5% |
| Immigrants | Central America | 0.0 /100 | #274 | Tragic 7.5% |
| Immigrants | Ghana | 0.0 /100 | #275 | Tragic 7.5% |
| French American Indians | 0.0 /100 | #276 | Tragic 7.5% |
Demographics Similar to Ugandans by Unemployment Among Ages 25 to 29 years
In terms of unemployment among ages 25 to 29 years, the demographic groups most similar to Ugandans are Immigrants from England (6.8%, a difference of 0.010%), Scotch-Irish (6.8%, a difference of 0.020%), Immigrants from Denmark (6.8%, a difference of 0.070%), Immigrants from Germany (6.8%, a difference of 0.090%), and Immigrants from Norway (6.8%, a difference of 0.14%).
| Demographics | Rating | Rank | Unemployment Among Ages 25 to 29 years |
| Guamanians/Chamorros | 24.3 /100 | #199 | Fair 6.8% |
| South American Indians | 23.3 /100 | #200 | Fair 6.8% |
| Basques | 22.5 /100 | #201 | Fair 6.8% |
| Immigrants | Argentina | 21.6 /100 | #202 | Fair 6.8% |
| Immigrants | Norway | 21.2 /100 | #203 | Fair 6.8% |
| Scotch-Irish | 20.0 /100 | #204 | Poor 6.8% |
| Immigrants | England | 19.8 /100 | #205 | Poor 6.8% |
| Ugandans | 19.8 /100 | #206 | Poor 6.8% |
| Immigrants | Denmark | 19.0 /100 | #207 | Poor 6.8% |
| Immigrants | Germany | 18.8 /100 | #208 | Poor 6.8% |
| Hawaiians | 17.1 /100 | #209 | Poor 6.8% |
| Canadians | 16.9 /100 | #210 | Poor 6.8% |
| Immigrants | Philippines | 16.7 /100 | #211 | Poor 6.8% |
| Immigrants | Cabo Verde | 16.2 /100 | #212 | Poor 6.8% |
| Immigrants | Syria | 15.1 /100 | #213 | Poor 6.8% |