Immigrants from Kenya vs Immigrants from Sweden Unemployment Among Ages 55 to 59 years

COMPARE

Immigrants from Kenya
Race
Ancestry
AfghanAfricanAlaska NativeAlaskan AthabascanAlbanianAleutAlsatianAmericanApacheArabArapahoArgentineanArmenianAssyrian/Chaldean/SyriacAustralianAustrianBahamianBangladeshiBarbadianBasqueBelgianBelizeanBermudanBhutaneseBlackfeetBolivianBrazilianBritishBritish West IndianBulgarianBurmeseCajunCambodianCanadianCape VerdeanCarpatho RusynCelticCentral AmericanCentral American IndianCherokeeCheyenneChickasawChileanChineseChippewaChoctawColombianColvilleComancheCosta RicanCreeCreekCroatianCrowCubanCypriotCzechCzechoslovakianDanishDelawareDominicanDutchDutch West IndianEastern EuropeanEcuadorianEgyptianEnglishEstonianEthiopianEuropeanFijianFilipinoFinnishFrenchFrench American IndianFrench CanadianGermanGerman RussianGhanaianGreekGuamanian/ChamorroGuatemalanGuyaneseHaitianHmongHonduranHopiHoumaHungarianIcelanderIndian (Asian)IndonesianInupiatIranianIraqiIrishIroquoisIsraeliItalianJamaicanJapaneseJordanianKenyanKiowaKoreanLaotianLatvianLebaneseLiberianLithuanianLumbeeLuxembourgerMacedonianMalaysianMalteseMarshalleseMenomineeMexicanMexican American IndianMongolianMoroccanNative HawaiianNavajoNepaleseNew ZealanderNicaraguanNigerianNorthern EuropeanNorwegianOkinawanOsageOttawaPaiutePakistaniPalestinianPanamanianParaguayanPennsylvania GermanPeruvianPimaPolishPortuguesePotawatomiPuebloPuerto RicanPuget Sound SalishRomanianRussianSalvadoranSamoanScandinavianScotch-IrishScottishSeminoleSenegaleseSerbianShoshoneSierra LeoneanSiouxSlavicSlovakSloveneSomaliSouth AfricanSouth AmericanSouth American IndianSoviet UnionSpaniardSpanishSpanish AmericanSpanish American IndianSri LankanSubsaharan AfricanSudaneseSwedishSwissSyrianTaiwaneseThaiTlingit-HaidaTohono O'OdhamTonganTrinidadian and TobagonianTsimshianTurkishU.S. Virgin IslanderUgandanUkrainianUruguayanUteVenezuelanVietnameseWelshWest IndianYakamaYaquiYugoslavianYumanYup'ikZimbabwean
Immigration
NonimmigrantsImmigrantsAfghanistanAfricaAlbaniaArgentinaArmeniaAsiaAustraliaAustriaBahamasBangladeshBarbadosBelarusBelgiumBelizeBoliviaBosnia and HerzegovinaBrazilBulgariaBurma/MyanmarCabo VerdeCambodiaCameroonCanadaCaribbeanCentral AmericaChileChinaColombiaCongoCosta RicaCroatiaCubaCzechoslovakiaDenmarkDominicaDominican RepublicEastern AfricaEastern AsiaEastern EuropeEcuadorEgyptEl SalvadorEnglandEritreaEthiopiaEuropeFijiFranceGermanyGhanaGreeceGrenadaGuatemalaGuyanaHaitiHondurasHong KongHungaryIndiaIndonesiaIranIraqIrelandIsraelItalyJamaicaJapanJordanKazakhstanKenyaKoreaKuwaitLaosLatin AmericaLatviaLebanonLiberiaLithuaniaMalaysiaMexicoMicronesiaMiddle AfricaMoldovaMoroccoNepalNetherlandsNicaraguaNigeriaNorth AmericaNorth MacedoniaNorthern AfricaNorthern EuropeNorwayOceaniaPakistanPanamaPeruPhilippinesPolandPortugalRomaniaRussiaSaudi ArabiaScotlandSenegalSerbiaSierra LeoneSingaporeSomaliaSouth AfricaSouth AmericaSouth Central AsiaSouth Eastern AsiaSouthern EuropeSpainSri LankaSt. Vincent and the GrenadinesSudanSwitzerlandSyriaTaiwanThailandTrinidad and TobagoTurkeyUgandaUkraineUruguayUzbekistanVenezuelaVietnamWest IndiesWestern AfricaWestern AsiaWestern EuropeYemenZaireZimbabweAzores
Immigrants from Sweden
Race
Ancestry
AfghanAfricanAlaska NativeAlaskan AthabascanAlbanianAleutAlsatianAmericanApacheArabArapahoArgentineanArmenianAssyrian/Chaldean/SyriacAustralianAustrianBahamianBangladeshiBarbadianBasqueBelgianBelizeanBermudanBhutaneseBlackfeetBolivianBrazilianBritishBritish West IndianBulgarianBurmeseCajunCambodianCanadianCape VerdeanCarpatho RusynCelticCentral AmericanCentral American IndianCherokeeCheyenneChickasawChileanChineseChippewaChoctawColombianColvilleComancheCosta RicanCreeCreekCroatianCrowCubanCypriotCzechCzechoslovakianDanishDelawareDominicanDutchDutch West IndianEastern EuropeanEcuadorianEgyptianEnglishEstonianEthiopianEuropeanFijianFilipinoFinnishFrenchFrench American IndianFrench CanadianGermanGerman RussianGhanaianGreekGuamanian/ChamorroGuatemalanGuyaneseHaitianHmongHonduranHopiHoumaHungarianIcelanderIndian (Asian)IndonesianInupiatIranianIraqiIrishIroquoisIsraeliItalianJamaicanJapaneseJordanianKenyanKiowaKoreanLaotianLatvianLebaneseLiberianLithuanianLumbeeLuxembourgerMacedonianMalaysianMalteseMarshalleseMenomineeMexicanMexican American IndianMongolianMoroccanNative HawaiianNavajoNepaleseNew ZealanderNicaraguanNigerianNorthern EuropeanNorwegianOkinawanOsageOttawaPaiutePakistaniPalestinianPanamanianParaguayanPennsylvania GermanPeruvianPimaPolishPortuguesePotawatomiPuebloPuerto RicanPuget Sound SalishRomanianRussianSalvadoranSamoanScandinavianScotch-IrishScottishSeminoleSenegaleseSerbianShoshoneSierra LeoneanSiouxSlavicSlovakSloveneSomaliSouth AfricanSouth AmericanSouth American IndianSoviet UnionSpaniardSpanishSpanish AmericanSpanish American IndianSri LankanSubsaharan AfricanSudaneseSwedishSwissSyrianTaiwaneseThaiTlingit-HaidaTohono O'OdhamTonganTrinidadian and TobagonianTsimshianTurkishU.S. Virgin IslanderUgandanUkrainianUruguayanUteVenezuelanVietnameseWelshWest IndianYakamaYaquiYugoslavianYumanYup'ikZimbabwean
Immigration
NonimmigrantsImmigrantsAfghanistanAfricaAlbaniaArgentinaArmeniaAsiaAustraliaAustriaBahamasBangladeshBarbadosBelarusBelgiumBelizeBoliviaBosnia and HerzegovinaBrazilBulgariaBurma/MyanmarCabo VerdeCambodiaCameroonCanadaCaribbeanCentral AmericaChileChinaColombiaCongoCosta RicaCroatiaCubaCzechoslovakiaDenmarkDominicaDominican RepublicEastern AfricaEastern AsiaEastern EuropeEcuadorEgyptEl SalvadorEnglandEritreaEthiopiaEuropeFijiFranceGermanyGhanaGreeceGrenadaGuatemalaGuyanaHaitiHondurasHong KongHungaryIndiaIndonesiaIranIraqIrelandIsraelItalyJamaicaJapanJordanKazakhstanKoreaKuwaitLaosLatin AmericaLatviaLebanonLiberiaLithuaniaMalaysiaMexicoMicronesiaMiddle AfricaMoldovaMoroccoNepalNetherlandsNicaraguaNigeriaNorth AmericaNorth MacedoniaNorthern AfricaNorthern EuropeNorwayOceaniaPakistanPanamaPeruPhilippinesPolandPortugalRomaniaRussiaSaudi ArabiaScotlandSenegalSerbiaSierra LeoneSingaporeSomaliaSouth AfricaSouth AmericaSouth Central AsiaSouth Eastern AsiaSouthern EuropeSpainSri LankaSt. Vincent and the GrenadinesSudanSwedenSwitzerlandSyriaTaiwanThailandTrinidad and TobagoTurkeyUgandaUkraineUruguayUzbekistanVenezuelaVietnamWest IndiesWestern AfricaWestern AsiaWestern EuropeYemenZaireZimbabweAzores
Unemployment Among Ages 55 to 59 years
Income
Poverty
Unemployment
Labor Participation
Family Structure
Vehicle Availability
Education Level
Disability

Unemployment Among Ages 55 to 59 years Comparison

Immigrants from Kenya

Immigrants from Sweden

Exceptional
Excellent
4.5%
UNEMPLOYMENT AMONG AGES 55 TO 59 YEARS
99.9/ 100
METRIC RATING
30th/ 347
METRIC RANK
4.7%
UNEMPLOYMENT AMONG AGES 55 TO 59 YEARS
86.8/ 100
METRIC RATING
129th/ 347
METRIC RANK

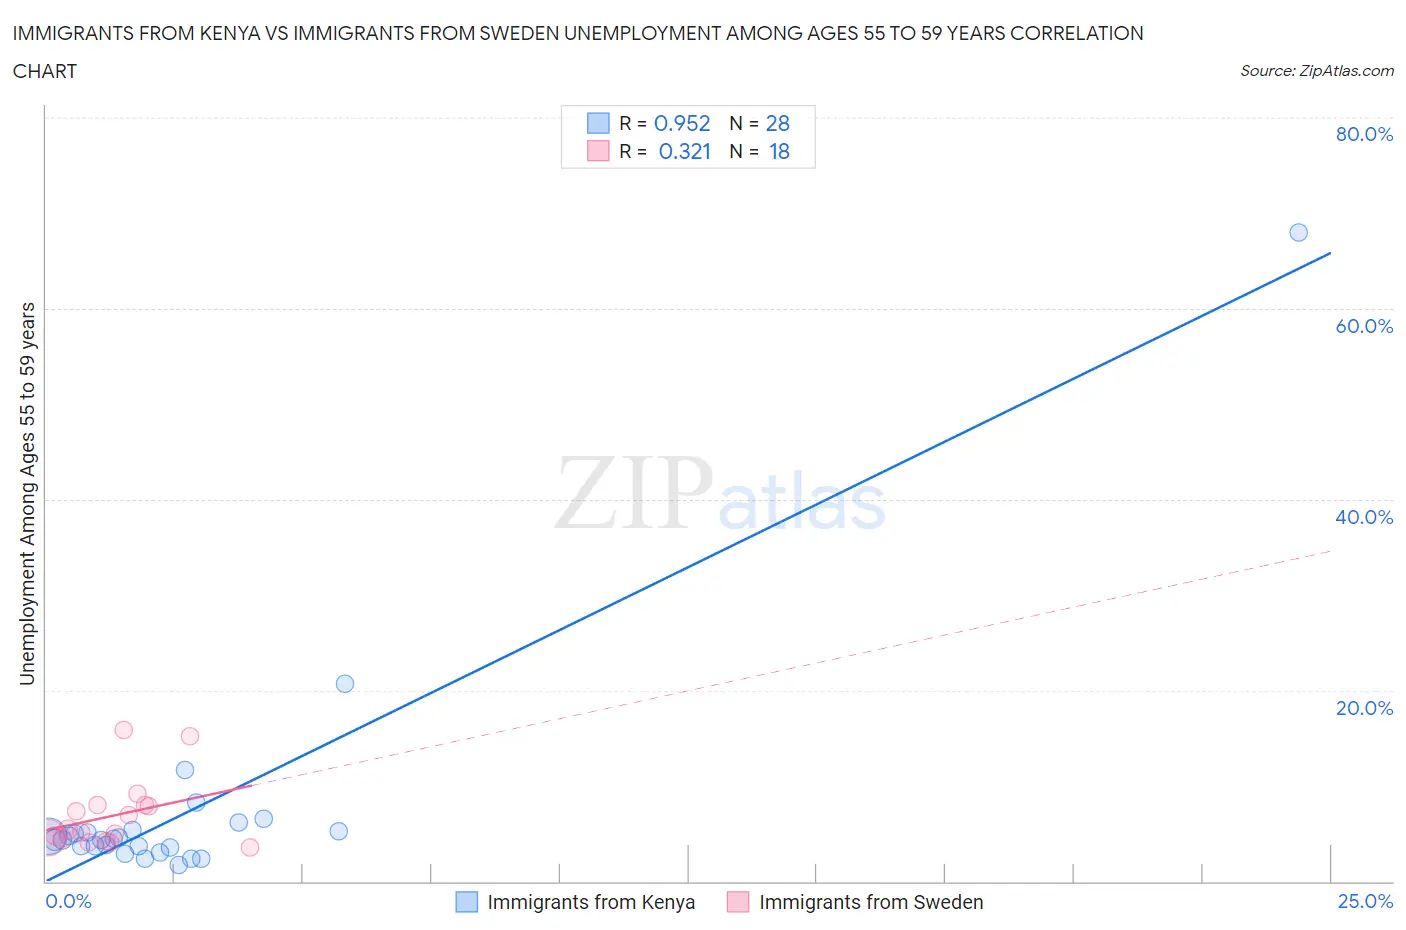
Immigrants from Kenya vs Immigrants from Sweden Unemployment Among Ages 55 to 59 years Correlation Chart

The statistical analysis conducted on geographies consisting of 210,703,413 people shows a perfect positive correlation between the proportion of Immigrants from Kenya and unemployment rate among population between the ages 55 and 59 in the United States with a correlation coefficient (R) of 0.952 and weighted average of 4.5%. Similarly, the statistical analysis conducted on geographies consisting of 159,531,989 people shows a mild positive correlation between the proportion of Immigrants from Sweden and unemployment rate among population between the ages 55 and 59 in the United States with a correlation coefficient (R) of 0.321 and weighted average of 4.7%, a difference of 6.0%.
Immigrants from Kenya vs Immigrants from Sweden Unemployment Among Ages 55 to 59 years

Unemployment Among Ages 55 to 59 years Correlation Summary

MeasurementImmigrants from KenyaImmigrants from Sweden
Minimum1.7%3.6%
Maximum68.0%15.9%
Range66.3%12.3%
Mean7.4%6.9%
Median4.4%5.2%
Interquartile 25% (IQ1)3.6%4.5%
Interquartile 75% (IQ3)5.3%8.0%
Interquartile Range (IQR)1.8%3.5%
Standard Deviation (Sample)12.4%3.6%
Standard Deviation (Population)12.2%3.5%

Similar Demographics by Unemployment Among Ages 55 to 59 years

Demographics Similar to Immigrants from Kenya by Unemployment Among Ages 55 to 59 years

In terms of unemployment among ages 55 to 59 years, the demographic groups most similar to Immigrants from Kenya are Palestinian (4.5%, a difference of 0.020%), Immigrants from Eastern Africa (4.5%, a difference of 0.050%), German (4.5%, a difference of 0.080%), Immigrants from Zimbabwe (4.5%, a difference of 0.10%), and Scandinavian (4.5%, a difference of 0.11%).
DemographicsRating | RankUnemployment Among Ages 55 to 59 years
Kenyans
100.0
/100
|
#23
Exceptional
4.4%
Jordanians
100.0
/100
|
#24
Exceptional
4.4%
Immigrants | Eritrea
100.0
/100
|
#25
Exceptional
4.4%
Scandinavians
99.9
/100
|
#26
Exceptional
4.5%
Immigrants | Zimbabwe
99.9
/100
|
#27
Exceptional
4.5%
Immigrants | Eastern Africa
99.9
/100
|
#28
Exceptional
4.5%
Palestinians
99.9
/100
|
#29
Exceptional
4.5%
Immigrants | Kenya
99.9
/100
|
#30
Exceptional
4.5%
Germans
99.9
/100
|
#31
Exceptional
4.5%
Immigrants | Ethiopia
99.9
/100
|
#32
Exceptional
4.5%
Belgians
99.9
/100
|
#33
Exceptional
4.5%
Thais
99.9
/100
|
#34
Exceptional
4.5%
Cypriots
99.9
/100
|
#35
Exceptional
4.5%
Ethiopians
99.9
/100
|
#36
Exceptional
4.5%
Immigrants | Bulgaria
99.9
/100
|
#37
Exceptional
4.5%

Demographics Similar to Immigrants from Sweden by Unemployment Among Ages 55 to 59 years

In terms of unemployment among ages 55 to 59 years, the demographic groups most similar to Immigrants from Sweden are Greek (4.7%, a difference of 0.010%), Pennsylvania German (4.7%, a difference of 0.030%), Immigrants from Serbia (4.7%, a difference of 0.090%), Icelander (4.7%, a difference of 0.090%), and Immigrants from Malaysia (4.7%, a difference of 0.11%).
DemographicsRating | RankUnemployment Among Ages 55 to 59 years
Immigrants | Afghanistan
89.5
/100
|
#122
Excellent
4.7%
Immigrants | Japan
89.4
/100
|
#123
Excellent
4.7%
Lithuanians
88.8
/100
|
#124
Excellent
4.7%
Immigrants | Malaysia
87.9
/100
|
#125
Excellent
4.7%
Immigrants | Serbia
87.8
/100
|
#126
Excellent
4.7%
Icelanders
87.7
/100
|
#127
Excellent
4.7%
Pennsylvania Germans
87.1
/100
|
#128
Excellent
4.7%
Immigrants | Sweden
86.8
/100
|
#129
Excellent
4.7%
Greeks
86.6
/100
|
#130
Excellent
4.7%
Immigrants | Thailand
85.4
/100
|
#131
Excellent
4.7%
Immigrants | Romania
85.3
/100
|
#132
Excellent
4.7%
Immigrants | Netherlands
84.5
/100
|
#133
Excellent
4.7%
Panamanians
84.1
/100
|
#134
Excellent
4.7%
Slavs
83.7
/100
|
#135
Excellent
4.7%
Colombians
83.6
/100
|
#136
Excellent
4.7%