Immigrants from Japan vs Syrian Unemployment

COMPARE

Immigrants from Japan
Race
Ancestry
AfghanAfricanAlaska NativeAlaskan AthabascanAlbanianAleutAlsatianAmericanApacheArabArapahoArgentineanArmenianAssyrian/Chaldean/SyriacAustralianAustrianBahamianBangladeshiBarbadianBasqueBelgianBelizeanBermudanBhutaneseBlackfeetBolivianBrazilianBritishBritish West IndianBulgarianBurmeseCajunCambodianCanadianCape VerdeanCarpatho RusynCelticCentral AmericanCentral American IndianCherokeeCheyenneChickasawChileanChineseChippewaChoctawColombianColvilleComancheCosta RicanCreeCreekCroatianCrowCubanCypriotCzechCzechoslovakianDanishDelawareDominicanDutchDutch West IndianEastern EuropeanEcuadorianEgyptianEnglishEstonianEthiopianEuropeanFijianFilipinoFinnishFrenchFrench American IndianFrench CanadianGermanGerman RussianGhanaianGreekGuamanian/ChamorroGuatemalanGuyaneseHaitianHmongHonduranHopiHoumaHungarianIcelanderIndian (Asian)IndonesianInupiatIranianIraqiIrishIroquoisIsraeliItalianJamaicanJapaneseJordanianKenyanKiowaKoreanLaotianLatvianLebaneseLiberianLithuanianLumbeeLuxembourgerMacedonianMalaysianMalteseMarshalleseMenomineeMexicanMexican American IndianMongolianMoroccanNative HawaiianNavajoNepaleseNew ZealanderNicaraguanNigerianNorthern EuropeanNorwegianOkinawanOsageOttawaPaiutePakistaniPalestinianPanamanianParaguayanPennsylvania GermanPeruvianPimaPolishPortuguesePotawatomiPuebloPuerto RicanPuget Sound SalishRomanianRussianSalvadoranSamoanScandinavianScotch-IrishScottishSeminoleSenegaleseSerbianShoshoneSierra LeoneanSiouxSlavicSlovakSloveneSomaliSouth AfricanSouth AmericanSouth American IndianSoviet UnionSpaniardSpanishSpanish AmericanSpanish American IndianSri LankanSubsaharan AfricanSudaneseSwedishSwissTaiwaneseThaiTlingit-HaidaTohono O'OdhamTonganTrinidadian and TobagonianTsimshianTurkishU.S. Virgin IslanderUgandanUkrainianUruguayanUteVenezuelanVietnameseWelshWest IndianYakamaYaquiYugoslavianYumanYup'ikZimbabwean
Immigration
NonimmigrantsImmigrantsAfghanistanAfricaAlbaniaArgentinaArmeniaAsiaAustraliaAustriaBahamasBangladeshBarbadosBelarusBelgiumBelizeBoliviaBosnia and HerzegovinaBrazilBulgariaBurma/MyanmarCabo VerdeCambodiaCameroonCanadaCaribbeanCentral AmericaChileChinaColombiaCongoCosta RicaCroatiaCubaCzechoslovakiaDenmarkDominicaDominican RepublicEastern AfricaEastern AsiaEastern EuropeEcuadorEgyptEl SalvadorEnglandEritreaEthiopiaEuropeFijiFranceGermanyGhanaGreeceGrenadaGuatemalaGuyanaHaitiHondurasHong KongHungaryIndiaIndonesiaIranIraqIrelandIsraelItalyJamaicaJapanJordanKazakhstanKenyaKoreaKuwaitLaosLatin AmericaLatviaLebanonLiberiaLithuaniaMalaysiaMexicoMicronesiaMiddle AfricaMoldovaMoroccoNepalNetherlandsNicaraguaNigeriaNorth AmericaNorth MacedoniaNorthern AfricaNorthern EuropeNorwayOceaniaPakistanPanamaPeruPhilippinesPolandPortugalRomaniaRussiaSaudi ArabiaScotlandSenegalSerbiaSierra LeoneSingaporeSomaliaSouth AfricaSouth AmericaSouth Central AsiaSouth Eastern AsiaSouthern EuropeSpainSri LankaSt. Vincent and the GrenadinesSudanSwedenSwitzerlandSyriaTaiwanThailandTrinidad and TobagoTurkeyUgandaUkraineUruguayUzbekistanVenezuelaVietnamWest IndiesWestern AfricaWestern AsiaWestern EuropeYemenZaireZimbabweAzores
Syrian
Race
Ancestry
AfghanAfricanAlaska NativeAlaskan AthabascanAlbanianAleutAlsatianAmericanApacheArabArapahoArgentineanArmenianAssyrian/Chaldean/SyriacAustralianAustrianBahamianBangladeshiBarbadianBasqueBelgianBelizeanBermudanBhutaneseBlackfeetBolivianBrazilianBritishBritish West IndianBulgarianBurmeseCajunCambodianCanadianCape VerdeanCarpatho RusynCelticCentral AmericanCentral American IndianCherokeeCheyenneChickasawChileanChineseChippewaChoctawColombianColvilleComancheCosta RicanCreeCreekCroatianCrowCubanCypriotCzechCzechoslovakianDanishDelawareDominicanDutchDutch West IndianEastern EuropeanEcuadorianEgyptianEnglishEstonianEthiopianEuropeanFijianFilipinoFinnishFrenchFrench American IndianFrench CanadianGermanGerman RussianGhanaianGreekGuamanian/ChamorroGuatemalanGuyaneseHaitianHmongHonduranHopiHoumaHungarianIcelanderIndian (Asian)IndonesianInupiatIranianIraqiIrishIroquoisIsraeliItalianJamaicanJapaneseJordanianKenyanKiowaKoreanLaotianLatvianLebaneseLiberianLithuanianLumbeeLuxembourgerMacedonianMalaysianMalteseMarshalleseMenomineeMexicanMexican American IndianMongolianMoroccanNative HawaiianNavajoNepaleseNew ZealanderNicaraguanNigerianNorthern EuropeanNorwegianOkinawanOsageOttawaPaiutePakistaniPalestinianPanamanianParaguayanPennsylvania GermanPeruvianPimaPolishPortuguesePotawatomiPuebloPuerto RicanPuget Sound SalishRomanianRussianSalvadoranSamoanScandinavianScotch-IrishScottishSeminoleSenegaleseSerbianShoshoneSierra LeoneanSiouxSlavicSlovakSloveneSomaliSouth AfricanSouth AmericanSouth American IndianSoviet UnionSpaniardSpanishSpanish AmericanSpanish American IndianSri LankanSubsaharan AfricanSudaneseSwedishSwissSyrianTaiwaneseThaiTlingit-HaidaTohono O'OdhamTonganTrinidadian and TobagonianTsimshianTurkishU.S. Virgin IslanderUgandanUkrainianUruguayanUteVenezuelanVietnameseWelshWest IndianYakamaYaquiYugoslavianYumanYup'ikZimbabwean
Immigration
NonimmigrantsImmigrantsAfghanistanAfricaAlbaniaArgentinaArmeniaAsiaAustraliaAustriaBahamasBangladeshBarbadosBelarusBelgiumBelizeBoliviaBosnia and HerzegovinaBrazilBulgariaBurma/MyanmarCabo VerdeCambodiaCameroonCanadaCaribbeanCentral AmericaChileChinaColombiaCongoCosta RicaCroatiaCubaCzechoslovakiaDenmarkDominicaDominican RepublicEastern AfricaEastern AsiaEastern EuropeEcuadorEgyptEl SalvadorEnglandEritreaEthiopiaEuropeFijiFranceGermanyGhanaGreeceGrenadaGuatemalaGuyanaHaitiHondurasHong KongHungaryIndiaIndonesiaIranIraqIrelandIsraelItalyJamaicaJordanKazakhstanKenyaKoreaKuwaitLaosLatin AmericaLatviaLebanonLiberiaLithuaniaMalaysiaMexicoMicronesiaMiddle AfricaMoldovaMoroccoNepalNetherlandsNicaraguaNigeriaNorth AmericaNorth MacedoniaNorthern AfricaNorthern EuropeNorwayOceaniaPakistanPanamaPeruPhilippinesPolandPortugalRomaniaRussiaSaudi ArabiaScotlandSenegalSerbiaSierra LeoneSingaporeSomaliaSouth AfricaSouth AmericaSouth Central AsiaSouth Eastern AsiaSouthern EuropeSpainSri LankaSt. Vincent and the GrenadinesSudanSwedenSwitzerlandSyriaTaiwanThailandTrinidad and TobagoTurkeyUgandaUkraineUruguayUzbekistanVenezuelaVietnamWest IndiesWestern AfricaWestern AsiaWestern EuropeYemenZaireZimbabweAzores
Unemployment
Income
Poverty
Unemployment
Labor Participation
Family Structure
Vehicle Availability
Education Level
Disability

Unemployment Comparison

Immigrants from Japan

Syrians

Exceptional
Good
4.9%
UNEMPLOYMENT
98.3/ 100
METRIC RATING
71st/ 347
METRIC RANK
5.2%
UNEMPLOYMENT
77.7/ 100
METRIC RATING
149th/ 347
METRIC RANK

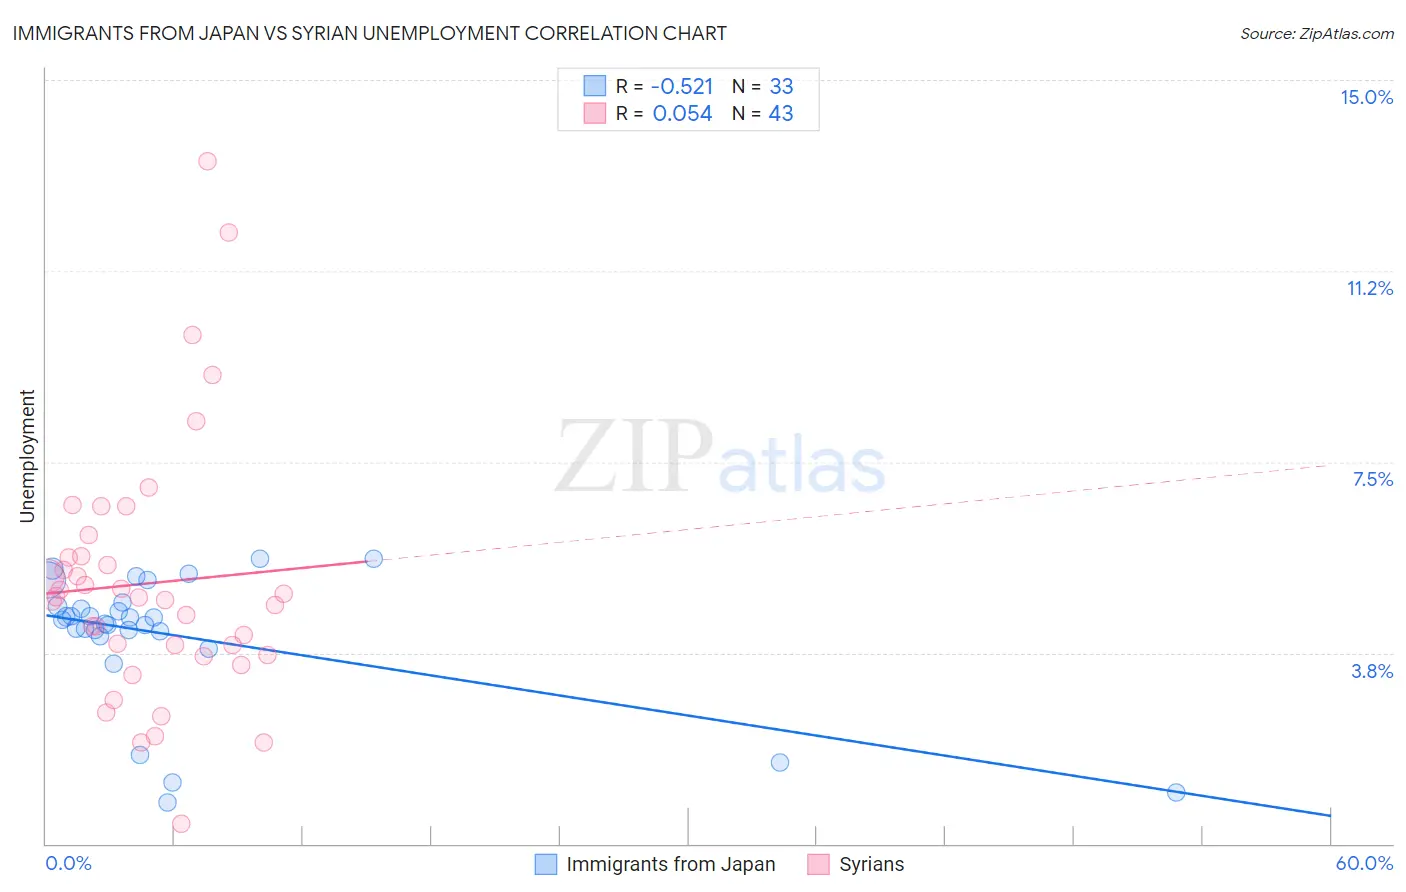
Immigrants from Japan vs Syrian Unemployment Correlation Chart

The statistical analysis conducted on geographies consisting of 339,966,426 people shows a substantial negative correlation between the proportion of Immigrants from Japan and unemployment in the United States with a correlation coefficient (R) of -0.521 and weighted average of 4.9%. Similarly, the statistical analysis conducted on geographies consisting of 266,191,069 people shows a slight positive correlation between the proportion of Syrians and unemployment in the United States with a correlation coefficient (R) of 0.054 and weighted average of 5.2%, a difference of 4.6%.
Immigrants from Japan vs Syrian Unemployment

Unemployment Correlation Summary

MeasurementImmigrants from JapanSyrian
Minimum0.80%0.40%
Maximum5.6%13.4%
Range4.8%13.0%
Mean4.1%5.1%
Median4.4%4.8%
Interquartile 25% (IQ1)4.1%3.7%
Interquartile 75% (IQ3)4.7%5.7%
Interquartile Range (IQR)0.58%2.0%
Standard Deviation (Sample)1.3%2.5%
Standard Deviation (Population)1.3%2.5%

Similar Demographics by Unemployment

Demographics Similar to Immigrants from Japan by Unemployment

In terms of unemployment, the demographic groups most similar to Immigrants from Japan are Burmese (4.9%, a difference of 0.020%), Serbian (4.9%, a difference of 0.050%), Paraguayan (4.9%, a difference of 0.070%), Immigrants from Northern Europe (4.9%, a difference of 0.16%), and Immigrants from North America (4.9%, a difference of 0.21%).
DemographicsRating | RankUnemployment
Italians
98.9
/100
|
#64
Exceptional
4.9%
Immigrants | Canada
98.8
/100
|
#65
Exceptional
4.9%
Slovaks
98.7
/100
|
#66
Exceptional
4.9%
New Zealanders
98.6
/100
|
#67
Exceptional
4.9%
Slavs
98.6
/100
|
#68
Exceptional
4.9%
Immigrants | North America
98.5
/100
|
#69
Exceptional
4.9%
Serbians
98.4
/100
|
#70
Exceptional
4.9%
Immigrants | Japan
98.3
/100
|
#71
Exceptional
4.9%
Burmese
98.3
/100
|
#72
Exceptional
4.9%
Paraguayans
98.3
/100
|
#73
Exceptional
4.9%
Immigrants | Northern Europe
98.2
/100
|
#74
Exceptional
4.9%
Turks
98.0
/100
|
#75
Exceptional
4.9%
German Russians
98.0
/100
|
#76
Exceptional
4.9%
Cypriots
97.9
/100
|
#77
Exceptional
4.9%
Okinawans
97.9
/100
|
#78
Exceptional
4.9%

Demographics Similar to Syrians by Unemployment

In terms of unemployment, the demographic groups most similar to Syrians are Immigrants from Italy (5.1%, a difference of 0.13%), Potawatomi (5.2%, a difference of 0.14%), Immigrants from Eastern Europe (5.2%, a difference of 0.21%), Immigrants from Hong Kong (5.2%, a difference of 0.22%), and Egyptian (5.2%, a difference of 0.22%).
DemographicsRating | RankUnemployment
Immigrants | Pakistan
83.2
/100
|
#142
Excellent
5.1%
Immigrants | Chile
82.8
/100
|
#143
Excellent
5.1%
Indonesians
82.3
/100
|
#144
Excellent
5.1%
Immigrants | Norway
81.8
/100
|
#145
Excellent
5.1%
Immigrants | Asia
81.8
/100
|
#146
Excellent
5.1%
Indians (Asian)
81.6
/100
|
#147
Excellent
5.1%
Immigrants | Italy
79.1
/100
|
#148
Good
5.1%
Syrians
77.7
/100
|
#149
Good
5.2%
Potawatomi
76.2
/100
|
#150
Good
5.2%
Immigrants | Eastern Europe
75.3
/100
|
#151
Good
5.2%
Immigrants | Hong Kong
75.2
/100
|
#152
Good
5.2%
Egyptians
75.2
/100
|
#153
Good
5.2%
Immigrants | China
74.7
/100
|
#154
Good
5.2%
Immigrants | Northern Africa
71.3
/100
|
#155
Good
5.2%
Immigrants | Kazakhstan
70.4
/100
|
#156
Good
5.2%