Immigrants from Italy vs Immigrants from Asia Unemployment Among Ages 55 to 59 years

COMPARE

Immigrants from Italy
Race
Ancestry
AfghanAfricanAlaska NativeAlaskan AthabascanAlbanianAleutAlsatianAmericanApacheArabArapahoArgentineanArmenianAssyrian/Chaldean/SyriacAustralianAustrianBahamianBangladeshiBarbadianBasqueBelgianBelizeanBermudanBhutaneseBlackfeetBolivianBrazilianBritishBritish West IndianBulgarianBurmeseCajunCambodianCanadianCape VerdeanCarpatho RusynCelticCentral AmericanCentral American IndianCherokeeCheyenneChickasawChileanChineseChippewaChoctawColombianColvilleComancheCosta RicanCreeCreekCroatianCrowCubanCypriotCzechCzechoslovakianDanishDelawareDominicanDutchDutch West IndianEastern EuropeanEcuadorianEgyptianEnglishEstonianEthiopianEuropeanFijianFilipinoFinnishFrenchFrench American IndianFrench CanadianGermanGerman RussianGhanaianGreekGuamanian/ChamorroGuatemalanGuyaneseHaitianHmongHonduranHopiHoumaHungarianIcelanderIndian (Asian)IndonesianInupiatIranianIraqiIrishIroquoisIsraeliItalianJamaicanJapaneseJordanianKenyanKiowaKoreanLaotianLatvianLebaneseLiberianLithuanianLumbeeLuxembourgerMacedonianMalaysianMalteseMarshalleseMenomineeMexicanMexican American IndianMongolianMoroccanNative HawaiianNavajoNepaleseNew ZealanderNicaraguanNigerianNorthern EuropeanNorwegianOkinawanOsageOttawaPaiutePakistaniPalestinianPanamanianParaguayanPennsylvania GermanPeruvianPimaPolishPortuguesePotawatomiPuebloPuerto RicanPuget Sound SalishRomanianRussianSalvadoranSamoanScandinavianScotch-IrishScottishSeminoleSenegaleseSerbianShoshoneSierra LeoneanSiouxSlavicSlovakSloveneSomaliSouth AfricanSouth AmericanSouth American IndianSoviet UnionSpaniardSpanishSpanish AmericanSpanish American IndianSri LankanSubsaharan AfricanSudaneseSwedishSwissSyrianTaiwaneseThaiTlingit-HaidaTohono O'OdhamTonganTrinidadian and TobagonianTsimshianTurkishU.S. Virgin IslanderUgandanUkrainianUruguayanUteVenezuelanVietnameseWelshWest IndianYakamaYaquiYugoslavianYumanYup'ikZimbabwean
Immigration
NonimmigrantsImmigrantsAfghanistanAfricaAlbaniaArgentinaArmeniaAustraliaAustriaBahamasBangladeshBarbadosBelarusBelgiumBelizeBoliviaBosnia and HerzegovinaBrazilBulgariaBurma/MyanmarCabo VerdeCambodiaCameroonCanadaCaribbeanCentral AmericaChileChinaColombiaCongoCosta RicaCroatiaCubaCzechoslovakiaDenmarkDominicaDominican RepublicEastern AfricaEastern AsiaEastern EuropeEcuadorEgyptEl SalvadorEnglandEritreaEthiopiaEuropeFijiFranceGermanyGhanaGreeceGrenadaGuatemalaGuyanaHaitiHondurasHong KongHungaryIndiaIndonesiaIranIraqIrelandIsraelItalyJamaicaJapanJordanKazakhstanKenyaKoreaKuwaitLaosLatin AmericaLatviaLebanonLiberiaLithuaniaMalaysiaMexicoMicronesiaMiddle AfricaMoldovaMoroccoNepalNetherlandsNicaraguaNigeriaNorth AmericaNorth MacedoniaNorthern AfricaNorthern EuropeNorwayOceaniaPakistanPanamaPeruPhilippinesPolandPortugalRomaniaRussiaSaudi ArabiaScotlandSenegalSerbiaSierra LeoneSingaporeSomaliaSouth AfricaSouth AmericaSouth Central AsiaSouth Eastern AsiaSouthern EuropeSpainSri LankaSt. Vincent and the GrenadinesSudanSwedenSwitzerlandSyriaTaiwanThailandTrinidad and TobagoTurkeyUgandaUkraineUruguayUzbekistanVenezuelaVietnamWest IndiesWestern AfricaWestern AsiaWestern EuropeYemenZaireZimbabweAzores
Immigrants from Asia
Race
Ancestry
AfghanAfricanAlaska NativeAlaskan AthabascanAlbanianAleutAlsatianAmericanApacheArabArapahoArgentineanArmenianAssyrian/Chaldean/SyriacAustralianAustrianBahamianBangladeshiBarbadianBasqueBelgianBelizeanBermudanBhutaneseBlackfeetBolivianBrazilianBritishBritish West IndianBulgarianBurmeseCajunCambodianCanadianCape VerdeanCarpatho RusynCelticCentral AmericanCentral American IndianCherokeeCheyenneChickasawChileanChineseChippewaChoctawColombianColvilleComancheCosta RicanCreeCreekCroatianCrowCubanCypriotCzechCzechoslovakianDanishDelawareDominicanDutchDutch West IndianEastern EuropeanEcuadorianEgyptianEnglishEstonianEthiopianEuropeanFijianFilipinoFinnishFrenchFrench American IndianFrench CanadianGermanGerman RussianGhanaianGreekGuamanian/ChamorroGuatemalanGuyaneseHaitianHmongHonduranHopiHoumaHungarianIcelanderIndian (Asian)IndonesianInupiatIranianIraqiIrishIroquoisIsraeliItalianJamaicanJapaneseJordanianKenyanKiowaKoreanLaotianLatvianLebaneseLiberianLithuanianLumbeeLuxembourgerMacedonianMalaysianMalteseMarshalleseMenomineeMexicanMexican American IndianMongolianMoroccanNative HawaiianNavajoNepaleseNew ZealanderNicaraguanNigerianNorthern EuropeanNorwegianOkinawanOsageOttawaPaiutePakistaniPalestinianPanamanianParaguayanPennsylvania GermanPeruvianPimaPolishPortuguesePotawatomiPuebloPuerto RicanPuget Sound SalishRomanianRussianSalvadoranSamoanScandinavianScotch-IrishScottishSeminoleSenegaleseSerbianShoshoneSierra LeoneanSiouxSlavicSlovakSloveneSomaliSouth AfricanSouth AmericanSouth American IndianSoviet UnionSpaniardSpanishSpanish AmericanSpanish American IndianSri LankanSubsaharan AfricanSudaneseSwedishSwissSyrianTaiwaneseThaiTlingit-HaidaTohono O'OdhamTonganTrinidadian and TobagonianTsimshianTurkishU.S. Virgin IslanderUgandanUkrainianUruguayanUteVenezuelanVietnameseWelshWest IndianYakamaYaquiYugoslavianYumanYup'ikZimbabwean
Immigration
NonimmigrantsImmigrantsAfghanistanAfricaAlbaniaArgentinaArmeniaAsiaAustraliaAustriaBahamasBangladeshBarbadosBelarusBelgiumBelizeBoliviaBosnia and HerzegovinaBrazilBulgariaBurma/MyanmarCabo VerdeCambodiaCameroonCanadaCaribbeanCentral AmericaChileChinaColombiaCongoCosta RicaCroatiaCubaCzechoslovakiaDenmarkDominicaDominican RepublicEastern AfricaEastern AsiaEastern EuropeEcuadorEgyptEl SalvadorEnglandEritreaEthiopiaEuropeFijiFranceGermanyGhanaGreeceGrenadaGuatemalaGuyanaHaitiHondurasHong KongHungaryIndiaIndonesiaIranIraqIrelandIsraelJamaicaJapanJordanKazakhstanKenyaKoreaKuwaitLaosLatin AmericaLatviaLebanonLiberiaLithuaniaMalaysiaMexicoMicronesiaMiddle AfricaMoldovaMoroccoNepalNetherlandsNicaraguaNigeriaNorth AmericaNorth MacedoniaNorthern AfricaNorthern EuropeNorwayOceaniaPakistanPanamaPeruPhilippinesPolandPortugalRomaniaRussiaSaudi ArabiaScotlandSenegalSerbiaSierra LeoneSingaporeSomaliaSouth AfricaSouth AmericaSouth Central AsiaSouth Eastern AsiaSouthern EuropeSpainSri LankaSt. Vincent and the GrenadinesSudanSwedenSwitzerlandSyriaTaiwanThailandTrinidad and TobagoTurkeyUgandaUkraineUruguayUzbekistanVenezuelaVietnamWest IndiesWestern AfricaWestern AsiaWestern EuropeYemenZaireZimbabweAzores
Unemployment Among Ages 55 to 59 years
Income
Poverty
Unemployment
Labor Participation
Family Structure
Vehicle Availability
Education Level
Disability

Unemployment Among Ages 55 to 59 years Comparison

Immigrants from Italy

Immigrants from Asia

Fair
Good
4.9%
UNEMPLOYMENT AMONG AGES 55 TO 59 YEARS
30.1/ 100
METRIC RATING
193rd/ 347
METRIC RANK
4.8%
UNEMPLOYMENT AMONG AGES 55 TO 59 YEARS
77.8/ 100
METRIC RATING
144th/ 347
METRIC RANK

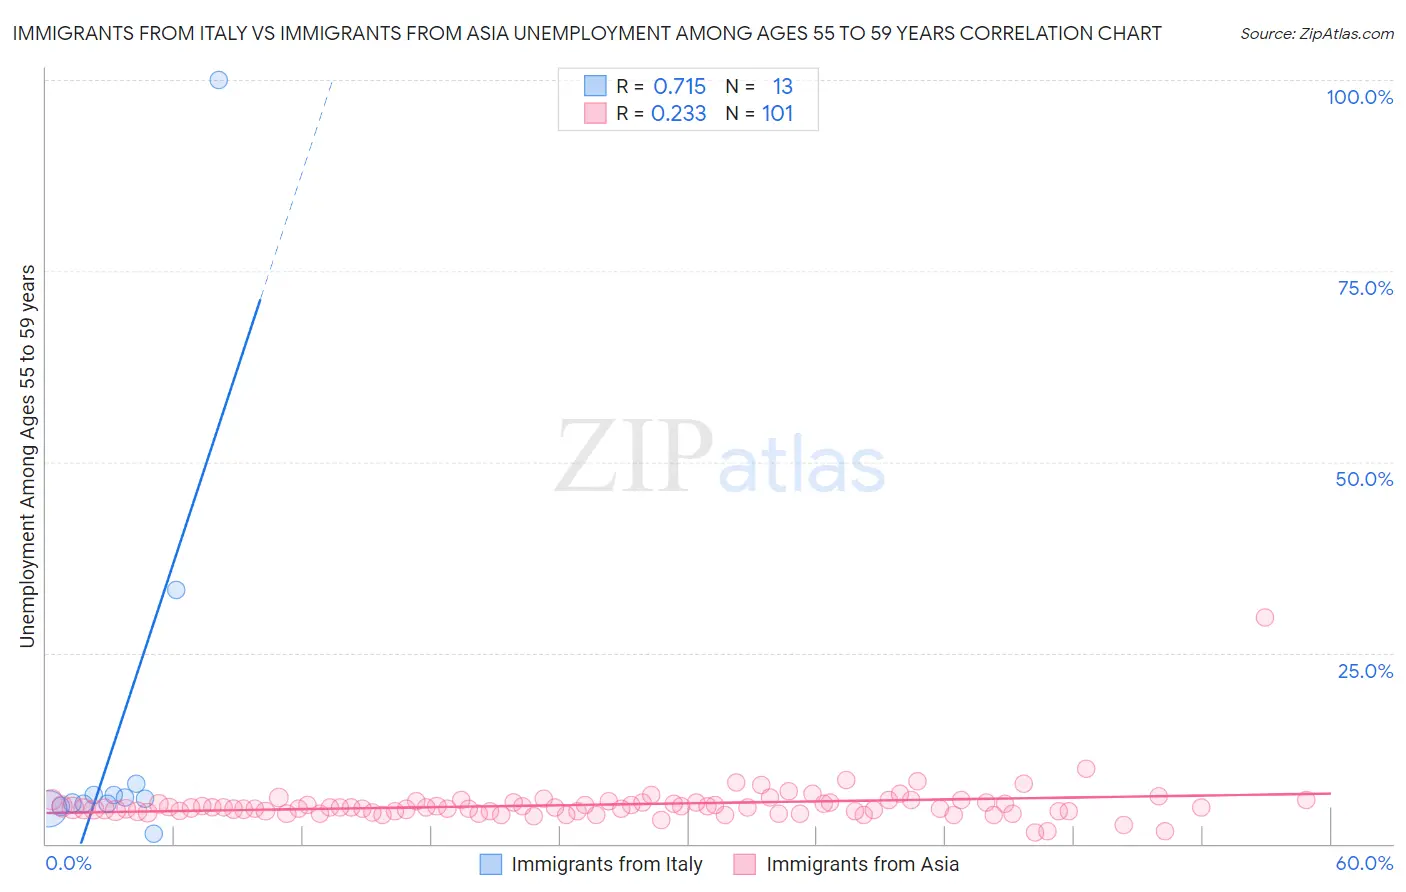
Immigrants from Italy vs Immigrants from Asia Unemployment Among Ages 55 to 59 years Correlation Chart

The statistical analysis conducted on geographies consisting of 306,994,240 people shows a strong positive correlation between the proportion of Immigrants from Italy and unemployment rate among population between the ages 55 and 59 in the United States with a correlation coefficient (R) of 0.715 and weighted average of 4.9%. Similarly, the statistical analysis conducted on geographies consisting of 479,879,185 people shows a weak positive correlation between the proportion of Immigrants from Asia and unemployment rate among population between the ages 55 and 59 in the United States with a correlation coefficient (R) of 0.233 and weighted average of 4.8%, a difference of 2.2%.
Immigrants from Italy vs Immigrants from Asia Unemployment Among Ages 55 to 59 years

Unemployment Among Ages 55 to 59 years Correlation Summary

MeasurementImmigrants from ItalyImmigrants from Asia
Minimum1.3%1.5%
Maximum100.0%29.7%
Range98.7%28.2%
Mean14.8%5.1%
Median5.9%4.7%
Interquartile 25% (IQ1)5.0%4.3%
Interquartile 75% (IQ3)7.2%5.5%
Interquartile Range (IQR)2.1%1.2%
Standard Deviation (Sample)26.8%2.8%
Standard Deviation (Population)25.7%2.8%

Similar Demographics by Unemployment Among Ages 55 to 59 years

Demographics Similar to Immigrants from Italy by Unemployment Among Ages 55 to 59 years

In terms of unemployment among ages 55 to 59 years, the demographic groups most similar to Immigrants from Italy are Immigrants from Ukraine (4.9%, a difference of 0.070%), Iranian (4.9%, a difference of 0.11%), Spaniard (4.9%, a difference of 0.14%), Estonian (4.9%, a difference of 0.14%), and Eastern European (4.9%, a difference of 0.17%).
DemographicsRating | RankUnemployment Among Ages 55 to 59 years
Osage
37.0
/100
|
#186
Fair
4.8%
Immigrants | Morocco
36.5
/100
|
#187
Fair
4.8%
Immigrants | Eastern Asia
36.1
/100
|
#188
Fair
4.8%
Iroquois
34.5
/100
|
#189
Fair
4.9%
Russians
33.9
/100
|
#190
Fair
4.9%
Iranians
32.4
/100
|
#191
Fair
4.9%
Immigrants | Ukraine
31.7
/100
|
#192
Fair
4.9%
Immigrants | Italy
30.1
/100
|
#193
Fair
4.9%
Spaniards
27.2
/100
|
#194
Fair
4.9%
Estonians
27.2
/100
|
#195
Fair
4.9%
Eastern Europeans
26.7
/100
|
#196
Fair
4.9%
Macedonians
26.4
/100
|
#197
Fair
4.9%
Immigrants | Philippines
26.1
/100
|
#198
Fair
4.9%
Immigrants | Russia
23.7
/100
|
#199
Fair
4.9%
Basques
23.3
/100
|
#200
Fair
4.9%

Demographics Similar to Immigrants from Asia by Unemployment Among Ages 55 to 59 years

In terms of unemployment among ages 55 to 59 years, the demographic groups most similar to Immigrants from Asia are Immigrants from Northern Europe (4.8%, a difference of 0.020%), Immigrants from South Eastern Asia (4.8%, a difference of 0.020%), Ukrainian (4.8%, a difference of 0.050%), Immigrants from Singapore (4.8%, a difference of 0.070%), and Immigrants from Norway (4.8%, a difference of 0.12%).
DemographicsRating | RankUnemployment Among Ages 55 to 59 years
Delaware
83.6
/100
|
#137
Excellent
4.7%
Immigrants | Switzerland
82.9
/100
|
#138
Excellent
4.7%
Romanians
82.7
/100
|
#139
Excellent
4.7%
Immigrants | Indonesia
80.2
/100
|
#140
Excellent
4.8%
French Canadians
80.1
/100
|
#141
Excellent
4.8%
Immigrants | Norway
79.8
/100
|
#142
Good
4.8%
Ukrainians
78.6
/100
|
#143
Good
4.8%
Immigrants | Asia
77.8
/100
|
#144
Good
4.8%
Immigrants | Northern Europe
77.5
/100
|
#145
Good
4.8%
Immigrants | South Eastern Asia
77.4
/100
|
#146
Good
4.8%
Immigrants | Singapore
76.6
/100
|
#147
Good
4.8%
Immigrants | Bahamas
71.8
/100
|
#148
Good
4.8%
Immigrants | Lithuania
70.8
/100
|
#149
Good
4.8%
Immigrants | Northern Africa
69.8
/100
|
#150
Good
4.8%
Bahamians
68.6
/100
|
#151
Good
4.8%