Immigrants from Italy vs Dutch Unemployment

COMPARE

Immigrants from Italy
Race
Ancestry
AfghanAfricanAlaska NativeAlaskan AthabascanAlbanianAleutAlsatianAmericanApacheArabArapahoArgentineanArmenianAssyrian/Chaldean/SyriacAustralianAustrianBahamianBangladeshiBarbadianBasqueBelgianBelizeanBermudanBhutaneseBlackfeetBolivianBrazilianBritishBritish West IndianBulgarianBurmeseCajunCambodianCanadianCape VerdeanCarpatho RusynCelticCentral AmericanCentral American IndianCherokeeCheyenneChickasawChileanChineseChippewaChoctawColombianColvilleComancheCosta RicanCreeCreekCroatianCrowCubanCypriotCzechCzechoslovakianDanishDelawareDominicanDutch West IndianEastern EuropeanEcuadorianEgyptianEnglishEstonianEthiopianEuropeanFijianFilipinoFinnishFrenchFrench American IndianFrench CanadianGermanGerman RussianGhanaianGreekGuamanian/ChamorroGuatemalanGuyaneseHaitianHmongHonduranHopiHoumaHungarianIcelanderIndian (Asian)IndonesianInupiatIranianIraqiIrishIroquoisIsraeliItalianJamaicanJapaneseJordanianKenyanKiowaKoreanLaotianLatvianLebaneseLiberianLithuanianLumbeeLuxembourgerMacedonianMalaysianMalteseMarshalleseMenomineeMexicanMexican American IndianMongolianMoroccanNative HawaiianNavajoNepaleseNew ZealanderNicaraguanNigerianNorthern EuropeanNorwegianOkinawanOsageOttawaPaiutePakistaniPalestinianPanamanianParaguayanPennsylvania GermanPeruvianPimaPolishPortuguesePotawatomiPuebloPuerto RicanPuget Sound SalishRomanianRussianSalvadoranSamoanScandinavianScotch-IrishScottishSeminoleSenegaleseSerbianShoshoneSierra LeoneanSiouxSlavicSlovakSloveneSomaliSouth AfricanSouth AmericanSouth American IndianSoviet UnionSpaniardSpanishSpanish AmericanSpanish American IndianSri LankanSubsaharan AfricanSudaneseSwedishSwissSyrianTaiwaneseThaiTlingit-HaidaTohono O'OdhamTonganTrinidadian and TobagonianTsimshianTurkishU.S. Virgin IslanderUgandanUkrainianUruguayanUteVenezuelanVietnameseWelshWest IndianYakamaYaquiYugoslavianYumanYup'ikZimbabwean
Immigration
NonimmigrantsImmigrantsAfghanistanAfricaAlbaniaArgentinaArmeniaAsiaAustraliaAustriaBahamasBangladeshBarbadosBelarusBelgiumBelizeBoliviaBosnia and HerzegovinaBrazilBulgariaBurma/MyanmarCabo VerdeCambodiaCameroonCanadaCaribbeanCentral AmericaChileChinaColombiaCongoCosta RicaCroatiaCubaCzechoslovakiaDenmarkDominicaDominican RepublicEastern AfricaEastern AsiaEastern EuropeEcuadorEgyptEl SalvadorEnglandEritreaEthiopiaEuropeFijiFranceGermanyGhanaGreeceGrenadaGuatemalaGuyanaHaitiHondurasHong KongHungaryIndiaIndonesiaIranIraqIrelandIsraelItalyJamaicaJapanJordanKazakhstanKenyaKoreaKuwaitLaosLatin AmericaLatviaLebanonLiberiaLithuaniaMalaysiaMexicoMicronesiaMiddle AfricaMoldovaMoroccoNepalNetherlandsNicaraguaNigeriaNorth AmericaNorth MacedoniaNorthern AfricaNorthern EuropeNorwayOceaniaPakistanPanamaPeruPhilippinesPolandPortugalRomaniaRussiaSaudi ArabiaScotlandSenegalSerbiaSierra LeoneSingaporeSomaliaSouth AfricaSouth AmericaSouth Central AsiaSouth Eastern AsiaSouthern EuropeSpainSri LankaSt. Vincent and the GrenadinesSudanSwedenSwitzerlandSyriaTaiwanThailandTrinidad and TobagoTurkeyUgandaUkraineUruguayUzbekistanVenezuelaVietnamWest IndiesWestern AfricaWestern AsiaWestern EuropeYemenZaireZimbabweAzores
Dutch
Race
Ancestry
AfghanAfricanAlaska NativeAlaskan AthabascanAlbanianAleutAlsatianAmericanApacheArabArapahoArgentineanArmenianAssyrian/Chaldean/SyriacAustralianAustrianBahamianBangladeshiBarbadianBasqueBelgianBelizeanBermudanBhutaneseBlackfeetBolivianBrazilianBritishBritish West IndianBulgarianBurmeseCajunCambodianCanadianCape VerdeanCarpatho RusynCelticCentral AmericanCentral American IndianCherokeeCheyenneChickasawChileanChineseChippewaChoctawColombianColvilleComancheCosta RicanCreeCreekCroatianCrowCubanCypriotCzechCzechoslovakianDanishDelawareDominicanDutchDutch West IndianEastern EuropeanEcuadorianEgyptianEnglishEstonianEthiopianEuropeanFijianFilipinoFinnishFrenchFrench American IndianFrench CanadianGermanGerman RussianGhanaianGreekGuamanian/ChamorroGuatemalanGuyaneseHaitianHmongHonduranHopiHoumaHungarianIcelanderIndian (Asian)IndonesianInupiatIranianIraqiIrishIroquoisIsraeliItalianJamaicanJapaneseJordanianKenyanKiowaKoreanLaotianLatvianLebaneseLiberianLithuanianLumbeeLuxembourgerMacedonianMalaysianMalteseMarshalleseMenomineeMexicanMexican American IndianMongolianMoroccanNative HawaiianNavajoNepaleseNew ZealanderNicaraguanNigerianNorthern EuropeanNorwegianOkinawanOsageOttawaPaiutePakistaniPalestinianPanamanianParaguayanPennsylvania GermanPeruvianPimaPolishPortuguesePotawatomiPuebloPuerto RicanPuget Sound SalishRomanianRussianSalvadoranSamoanScandinavianScotch-IrishScottishSeminoleSenegaleseSerbianShoshoneSierra LeoneanSiouxSlavicSlovakSloveneSomaliSouth AfricanSouth AmericanSouth American IndianSoviet UnionSpaniardSpanishSpanish AmericanSpanish American IndianSri LankanSubsaharan AfricanSudaneseSwedishSwissSyrianTaiwaneseThaiTlingit-HaidaTohono O'OdhamTonganTrinidadian and TobagonianTsimshianTurkishU.S. Virgin IslanderUgandanUkrainianUruguayanUteVenezuelanVietnameseWelshWest IndianYakamaYaquiYugoslavianYumanYup'ikZimbabwean
Immigration
NonimmigrantsImmigrantsAfghanistanAfricaAlbaniaArgentinaArmeniaAsiaAustraliaAustriaBahamasBangladeshBarbadosBelarusBelgiumBelizeBoliviaBosnia and HerzegovinaBrazilBulgariaBurma/MyanmarCabo VerdeCambodiaCameroonCanadaCaribbeanCentral AmericaChileChinaColombiaCongoCosta RicaCroatiaCubaCzechoslovakiaDenmarkDominicaDominican RepublicEastern AfricaEastern AsiaEastern EuropeEcuadorEgyptEl SalvadorEnglandEritreaEthiopiaEuropeFijiFranceGermanyGhanaGreeceGrenadaGuatemalaGuyanaHaitiHondurasHong KongHungaryIndiaIndonesiaIranIraqIrelandIsraelJamaicaJapanJordanKazakhstanKenyaKoreaKuwaitLaosLatin AmericaLatviaLebanonLiberiaLithuaniaMalaysiaMexicoMicronesiaMiddle AfricaMoldovaMoroccoNepalNetherlandsNicaraguaNigeriaNorth AmericaNorth MacedoniaNorthern AfricaNorthern EuropeNorwayOceaniaPakistanPanamaPeruPhilippinesPolandPortugalRomaniaRussiaSaudi ArabiaScotlandSenegalSerbiaSierra LeoneSingaporeSomaliaSouth AfricaSouth AmericaSouth Central AsiaSouth Eastern AsiaSouthern EuropeSpainSri LankaSt. Vincent and the GrenadinesSudanSwedenSwitzerlandSyriaTaiwanThailandTrinidad and TobagoTurkeyUgandaUkraineUruguayUzbekistanVenezuelaVietnamWest IndiesWestern AfricaWestern AsiaWestern EuropeYemenZaireZimbabweAzores
Unemployment
Income
Poverty
Unemployment
Labor Participation
Family Structure
Vehicle Availability
Education Level
Disability

Unemployment Comparison

Immigrants from Italy

Dutch

Good
Exceptional
5.1%
UNEMPLOYMENT
79.1/ 100
METRIC RATING
148th/ 347
METRIC RANK
4.6%
UNEMPLOYMENT
100.0/ 100
METRIC RATING
10th/ 347
METRIC RANK

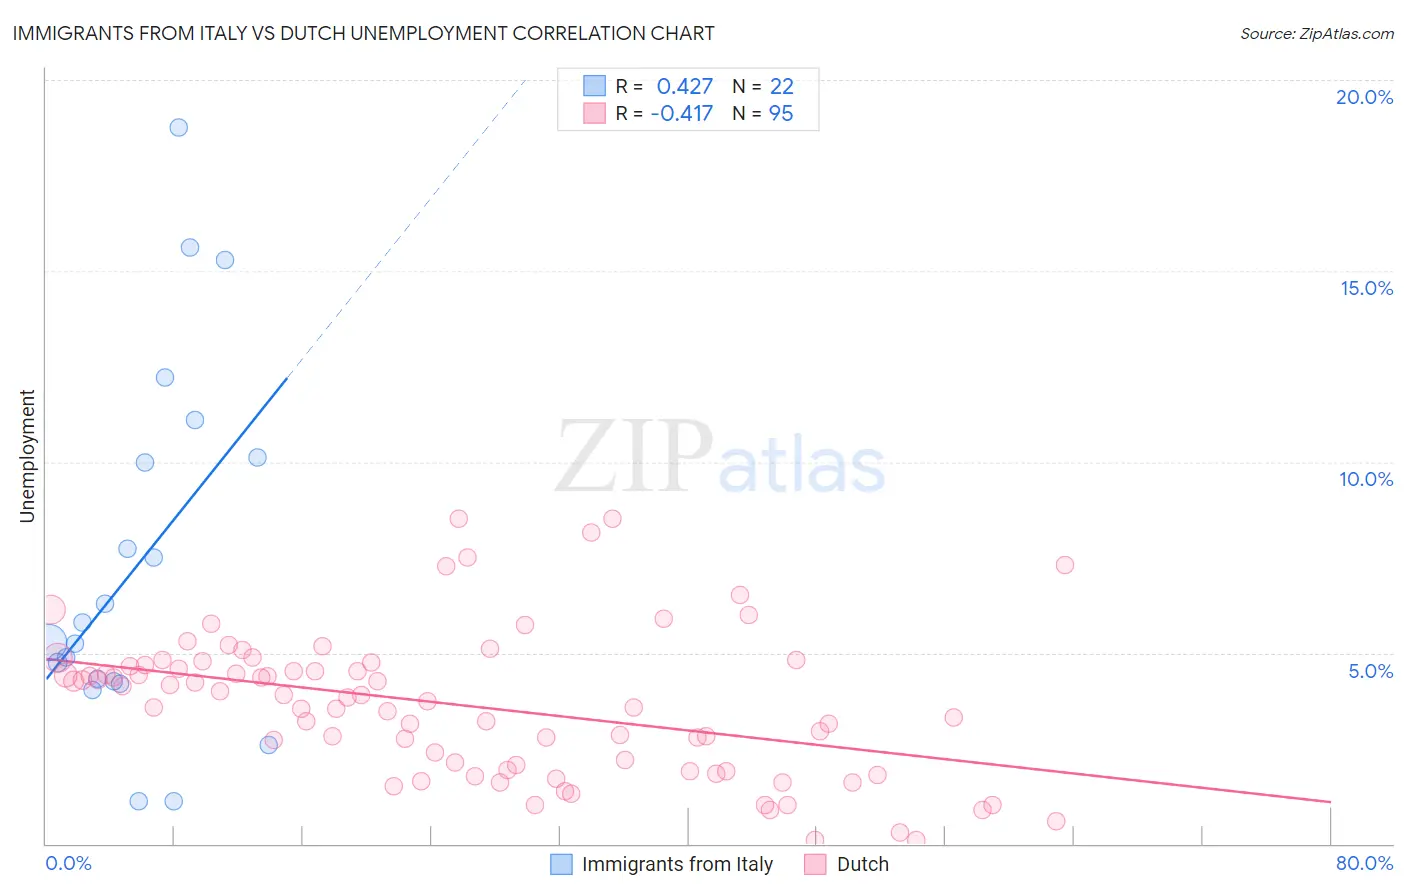
Immigrants from Italy vs Dutch Unemployment Correlation Chart

The statistical analysis conducted on geographies consisting of 324,002,453 people shows a moderate positive correlation between the proportion of Immigrants from Italy and unemployment in the United States with a correlation coefficient (R) of 0.427 and weighted average of 5.1%. Similarly, the statistical analysis conducted on geographies consisting of 551,058,238 people shows a moderate negative correlation between the proportion of Dutch and unemployment in the United States with a correlation coefficient (R) of -0.417 and weighted average of 4.6%, a difference of 12.7%.
Immigrants from Italy vs Dutch Unemployment

Unemployment Correlation Summary

MeasurementImmigrants from ItalyDutch
Minimum1.1%0.10%
Maximum18.8%8.5%
Range17.7%8.4%
Mean7.4%3.6%
Median5.5%3.8%
Interquartile 25% (IQ1)4.3%1.9%
Interquartile 75% (IQ3)10.1%4.7%
Interquartile Range (IQR)5.8%2.8%
Standard Deviation (Sample)4.8%1.9%
Standard Deviation (Population)4.7%1.9%

Similar Demographics by Unemployment

Demographics Similar to Immigrants from Italy by Unemployment

In terms of unemployment, the demographic groups most similar to Immigrants from Italy are Syrian (5.2%, a difference of 0.13%), Indian (Asian) (5.1%, a difference of 0.26%), Potawatomi (5.2%, a difference of 0.26%), Immigrants from Norway (5.1%, a difference of 0.27%), and Immigrants from Asia (5.1%, a difference of 0.27%).
DemographicsRating | RankUnemployment
Palestinians
83.4
/100
|
#141
Excellent
5.1%
Immigrants | Pakistan
83.2
/100
|
#142
Excellent
5.1%
Immigrants | Chile
82.8
/100
|
#143
Excellent
5.1%
Indonesians
82.3
/100
|
#144
Excellent
5.1%
Immigrants | Norway
81.8
/100
|
#145
Excellent
5.1%
Immigrants | Asia
81.8
/100
|
#146
Excellent
5.1%
Indians (Asian)
81.6
/100
|
#147
Excellent
5.1%
Immigrants | Italy
79.1
/100
|
#148
Good
5.1%
Syrians
77.7
/100
|
#149
Good
5.2%
Potawatomi
76.2
/100
|
#150
Good
5.2%
Immigrants | Eastern Europe
75.3
/100
|
#151
Good
5.2%
Immigrants | Hong Kong
75.2
/100
|
#152
Good
5.2%
Egyptians
75.2
/100
|
#153
Good
5.2%
Immigrants | China
74.7
/100
|
#154
Good
5.2%
Immigrants | Northern Africa
71.3
/100
|
#155
Good
5.2%

Demographics Similar to Dutch by Unemployment

In terms of unemployment, the demographic groups most similar to Dutch are Scandinavian (4.5%, a difference of 0.51%), English (4.6%, a difference of 0.66%), Pennsylvania German (4.6%, a difference of 0.76%), Swiss (4.5%, a difference of 0.90%), and Belgian (4.6%, a difference of 0.93%).
DemographicsRating | RankUnemployment
Czechs
100.0
/100
|
#3
Exceptional
4.3%
Danes
100.0
/100
|
#4
Exceptional
4.3%
Swedes
100.0
/100
|
#5
Exceptional
4.4%
Germans
100.0
/100
|
#6
Exceptional
4.5%
Immigrants | India
100.0
/100
|
#7
Exceptional
4.5%
Swiss
100.0
/100
|
#8
Exceptional
4.5%
Scandinavians
100.0
/100
|
#9
Exceptional
4.5%
Dutch
100.0
/100
|
#10
Exceptional
4.6%
English
100.0
/100
|
#11
Exceptional
4.6%
Pennsylvania Germans
100.0
/100
|
#12
Exceptional
4.6%
Belgians
100.0
/100
|
#13
Exceptional
4.6%
Immigrants | Cuba
100.0
/100
|
#14
Exceptional
4.6%
Europeans
99.9
/100
|
#15
Exceptional
4.6%
Chinese
99.9
/100
|
#16
Exceptional
4.7%
Slovenes
99.9
/100
|
#17
Exceptional
4.7%