Immigrants from Israel vs Houma Female Unemployment
COMPARE
Immigrants from Israel
Houma
Female Unemployment
Female Unemployment Comparison
Immigrants from Israel
Houma
5.4%
FEMALE UNEMPLOYMENT
19.7/ 100
METRIC RATING
204th/ 347
METRIC RANK
6.4%
FEMALE UNEMPLOYMENT
0.0/ 100
METRIC RATING
316th/ 347
METRIC RANK
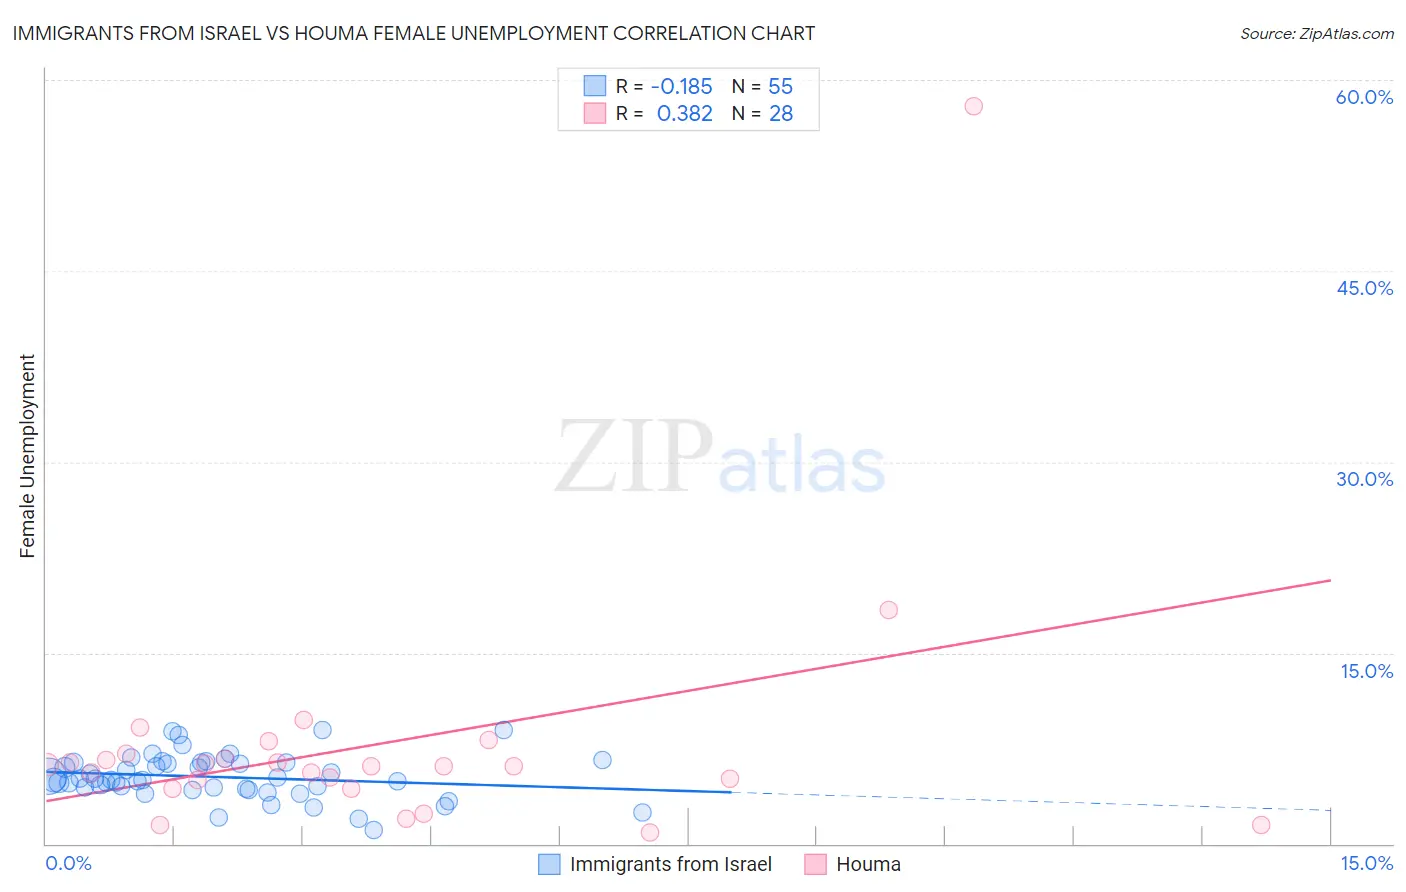
Immigrants from Israel vs Houma Female Unemployment Correlation Chart
The statistical analysis conducted on geographies consisting of 209,717,487 people shows a poor negative correlation between the proportion of Immigrants from Israel and unemploymnet rate among females in the United States with a correlation coefficient (R) of -0.185 and weighted average of 5.4%. Similarly, the statistical analysis conducted on geographies consisting of 36,709,264 people shows a mild positive correlation between the proportion of Houma and unemploymnet rate among females in the United States with a correlation coefficient (R) of 0.382 and weighted average of 6.4%, a difference of 19.2%.
Female Unemployment Correlation Summary
| Measurement | Immigrants from Israel | Houma |
| Minimum | 1.1% | 0.90% |
| Maximum | 8.9% | 57.9% |
| Range | 7.8% | 57.0% |
| Mean | 5.2% | 7.8% |
| Median | 5.0% | 6.1% |
| Interquartile 25% (IQ1) | 4.3% | 4.7% |
| Interquartile 75% (IQ3) | 6.4% | 6.9% |
| Interquartile Range (IQR) | 2.1% | 2.2% |
| Standard Deviation (Sample) | 1.7% | 10.4% |
| Standard Deviation (Population) | 1.7% | 10.2% |
Similar Demographics by Female Unemployment
Demographics Similar to Immigrants from Israel by Female Unemployment
In terms of female unemployment, the demographic groups most similar to Immigrants from Israel are Immigrants from South Eastern Asia (5.4%, a difference of 0.060%), Immigrants from Afghanistan (5.4%, a difference of 0.070%), Immigrants from Brazil (5.4%, a difference of 0.090%), Immigrants from Middle Africa (5.4%, a difference of 0.10%), and Iroquois (5.4%, a difference of 0.10%).
| Demographics | Rating | Rank | Female Unemployment |
| Alsatians | 23.9 /100 | #197 | Fair 5.3% |
| Tsimshian | 23.1 /100 | #198 | Fair 5.4% |
| Hawaiians | 22.2 /100 | #199 | Fair 5.4% |
| Soviet Union | 21.7 /100 | #200 | Fair 5.4% |
| Immigrants | Middle Africa | 20.8 /100 | #201 | Fair 5.4% |
| Iroquois | 20.8 /100 | #202 | Fair 5.4% |
| Immigrants | South Eastern Asia | 20.3 /100 | #203 | Fair 5.4% |
| Immigrants | Israel | 19.7 /100 | #204 | Poor 5.4% |
| Immigrants | Afghanistan | 18.9 /100 | #205 | Poor 5.4% |
| Immigrants | Brazil | 18.8 /100 | #206 | Poor 5.4% |
| Creek | 15.4 /100 | #207 | Poor 5.4% |
| Immigrants | Costa Rica | 13.7 /100 | #208 | Poor 5.4% |
| Koreans | 13.4 /100 | #209 | Poor 5.4% |
| Choctaw | 12.3 /100 | #210 | Poor 5.4% |
| Ottawa | 11.6 /100 | #211 | Poor 5.4% |
Demographics Similar to Houma by Female Unemployment
In terms of female unemployment, the demographic groups most similar to Houma are Pueblo (6.4%, a difference of 0.29%), Immigrants from St. Vincent and the Grenadines (6.4%, a difference of 0.45%), Immigrants from Ecuador (6.4%, a difference of 0.60%), British West Indian (6.4%, a difference of 0.73%), and Belizean (6.3%, a difference of 0.83%).
| Demographics | Rating | Rank | Female Unemployment |
| Ecuadorians | 0.0 /100 | #309 | Tragic 6.3% |
| Central American Indians | 0.0 /100 | #310 | Tragic 6.3% |
| Immigrants | Mexico | 0.0 /100 | #311 | Tragic 6.3% |
| Immigrants | Grenada | 0.0 /100 | #312 | Tragic 6.3% |
| Belizeans | 0.0 /100 | #313 | Tragic 6.3% |
| Immigrants | Ecuador | 0.0 /100 | #314 | Tragic 6.4% |
| Pueblo | 0.0 /100 | #315 | Tragic 6.4% |
| Houma | 0.0 /100 | #316 | Tragic 6.4% |
| Immigrants | St. Vincent and the Grenadines | 0.0 /100 | #317 | Tragic 6.4% |
| British West Indians | 0.0 /100 | #318 | Tragic 6.4% |
| Immigrants | Bangladesh | 0.0 /100 | #319 | Tragic 6.5% |
| Immigrants | Dominica | 0.0 /100 | #320 | Tragic 6.5% |
| Blacks/African Americans | 0.0 /100 | #321 | Tragic 6.5% |
| Vietnamese | 0.0 /100 | #322 | Tragic 6.5% |
| Immigrants | Belize | 0.0 /100 | #323 | Tragic 6.5% |