Immigrants from Israel vs Egyptian Unemployment Among Ages 16 to 19 years

COMPARE

Immigrants from Israel
Race
Ancestry
AfghanAfricanAlaska NativeAlaskan AthabascanAlbanianAleutAlsatianAmericanApacheArabArapahoArgentineanArmenianAssyrian/Chaldean/SyriacAustralianAustrianBahamianBangladeshiBarbadianBasqueBelgianBelizeanBermudanBhutaneseBlackfeetBolivianBrazilianBritishBritish West IndianBulgarianBurmeseCajunCambodianCanadianCape VerdeanCarpatho RusynCelticCentral AmericanCentral American IndianCherokeeCheyenneChickasawChileanChineseChippewaChoctawColombianColvilleComancheCosta RicanCreeCreekCroatianCrowCubanCypriotCzechCzechoslovakianDanishDelawareDominicanDutchDutch West IndianEastern EuropeanEcuadorianEnglishEstonianEthiopianEuropeanFijianFilipinoFinnishFrenchFrench American IndianFrench CanadianGermanGerman RussianGhanaianGreekGuamanian/ChamorroGuatemalanGuyaneseHaitianHmongHonduranHopiHoumaHungarianIcelanderIndian (Asian)IndonesianInupiatIranianIraqiIrishIroquoisIsraeliItalianJamaicanJapaneseJordanianKenyanKiowaKoreanLaotianLatvianLebaneseLiberianLithuanianLumbeeLuxembourgerMacedonianMalaysianMalteseMarshalleseMenomineeMexicanMexican American IndianMongolianMoroccanNative HawaiianNavajoNepaleseNew ZealanderNicaraguanNigerianNorthern EuropeanNorwegianOkinawanOsageOttawaPaiutePakistaniPalestinianPanamanianParaguayanPennsylvania GermanPeruvianPimaPolishPortuguesePotawatomiPuebloPuerto RicanPuget Sound SalishRomanianRussianSalvadoranSamoanScandinavianScotch-IrishScottishSeminoleSenegaleseSerbianShoshoneSierra LeoneanSiouxSlavicSlovakSloveneSomaliSouth AfricanSouth AmericanSouth American IndianSoviet UnionSpaniardSpanishSpanish AmericanSpanish American IndianSri LankanSubsaharan AfricanSudaneseSwedishSwissSyrianTaiwaneseThaiTlingit-HaidaTohono O'OdhamTonganTrinidadian and TobagonianTsimshianTurkishU.S. Virgin IslanderUgandanUkrainianUruguayanUteVenezuelanVietnameseWelshWest IndianYakamaYaquiYugoslavianYumanYup'ikZimbabwean
Immigration
NonimmigrantsImmigrantsAfghanistanAfricaAlbaniaArgentinaArmeniaAsiaAustraliaAustriaBahamasBangladeshBarbadosBelarusBelgiumBelizeBoliviaBosnia and HerzegovinaBrazilBulgariaBurma/MyanmarCabo VerdeCambodiaCameroonCanadaCaribbeanCentral AmericaChileChinaColombiaCongoCosta RicaCroatiaCubaCzechoslovakiaDenmarkDominicaDominican RepublicEastern AfricaEastern AsiaEastern EuropeEcuadorEgyptEl SalvadorEnglandEritreaEthiopiaEuropeFijiFranceGermanyGhanaGreeceGrenadaGuatemalaGuyanaHaitiHondurasHong KongHungaryIndiaIndonesiaIranIraqIrelandIsraelItalyJamaicaJapanJordanKazakhstanKenyaKoreaKuwaitLaosLatin AmericaLatviaLebanonLiberiaLithuaniaMalaysiaMexicoMicronesiaMiddle AfricaMoldovaMoroccoNepalNetherlandsNicaraguaNigeriaNorth AmericaNorth MacedoniaNorthern AfricaNorthern EuropeNorwayOceaniaPakistanPanamaPeruPhilippinesPolandPortugalRomaniaRussiaSaudi ArabiaScotlandSenegalSerbiaSierra LeoneSingaporeSomaliaSouth AfricaSouth AmericaSouth Central AsiaSouth Eastern AsiaSouthern EuropeSpainSri LankaSt. Vincent and the GrenadinesSudanSwedenSwitzerlandSyriaTaiwanThailandTrinidad and TobagoTurkeyUgandaUkraineUruguayUzbekistanVenezuelaVietnamWest IndiesWestern AfricaWestern AsiaWestern EuropeYemenZaireZimbabweAzores
Egyptian
Race
Ancestry
AfghanAfricanAlaska NativeAlaskan AthabascanAlbanianAleutAlsatianAmericanApacheArabArapahoArgentineanArmenianAssyrian/Chaldean/SyriacAustralianAustrianBahamianBangladeshiBarbadianBasqueBelgianBelizeanBermudanBhutaneseBlackfeetBolivianBrazilianBritishBritish West IndianBulgarianBurmeseCajunCambodianCanadianCape VerdeanCarpatho RusynCelticCentral AmericanCentral American IndianCherokeeCheyenneChickasawChileanChineseChippewaChoctawColombianColvilleComancheCosta RicanCreeCreekCroatianCrowCubanCypriotCzechCzechoslovakianDanishDelawareDominicanDutchDutch West IndianEastern EuropeanEcuadorianEgyptianEnglishEstonianEthiopianEuropeanFijianFilipinoFinnishFrenchFrench American IndianFrench CanadianGermanGerman RussianGhanaianGreekGuamanian/ChamorroGuatemalanGuyaneseHaitianHmongHonduranHopiHoumaHungarianIcelanderIndian (Asian)IndonesianInupiatIranianIraqiIrishIroquoisIsraeliItalianJamaicanJapaneseJordanianKenyanKiowaKoreanLaotianLatvianLebaneseLiberianLithuanianLumbeeLuxembourgerMacedonianMalaysianMalteseMarshalleseMenomineeMexicanMexican American IndianMongolianMoroccanNative HawaiianNavajoNepaleseNew ZealanderNicaraguanNigerianNorthern EuropeanNorwegianOkinawanOsageOttawaPaiutePakistaniPalestinianPanamanianParaguayanPennsylvania GermanPeruvianPimaPolishPortuguesePotawatomiPuebloPuerto RicanPuget Sound SalishRomanianRussianSalvadoranSamoanScandinavianScotch-IrishScottishSeminoleSenegaleseSerbianShoshoneSierra LeoneanSiouxSlavicSlovakSloveneSomaliSouth AfricanSouth AmericanSouth American IndianSoviet UnionSpaniardSpanishSpanish AmericanSpanish American IndianSri LankanSubsaharan AfricanSudaneseSwedishSwissSyrianTaiwaneseThaiTlingit-HaidaTohono O'OdhamTonganTrinidadian and TobagonianTsimshianTurkishU.S. Virgin IslanderUgandanUkrainianUruguayanUteVenezuelanVietnameseWelshWest IndianYakamaYaquiYugoslavianYumanYup'ikZimbabwean
Immigration
NonimmigrantsImmigrantsAfghanistanAfricaAlbaniaArgentinaArmeniaAsiaAustraliaAustriaBahamasBangladeshBarbadosBelarusBelgiumBelizeBoliviaBosnia and HerzegovinaBrazilBulgariaBurma/MyanmarCabo VerdeCambodiaCameroonCanadaCaribbeanCentral AmericaChileChinaColombiaCongoCosta RicaCroatiaCubaCzechoslovakiaDenmarkDominicaDominican RepublicEastern AfricaEastern AsiaEastern EuropeEcuadorEgyptEl SalvadorEnglandEritreaEthiopiaEuropeFijiFranceGermanyGhanaGreeceGrenadaGuatemalaGuyanaHaitiHondurasHong KongHungaryIndiaIndonesiaIranIraqIrelandItalyJamaicaJapanJordanKazakhstanKenyaKoreaKuwaitLaosLatin AmericaLatviaLebanonLiberiaLithuaniaMalaysiaMexicoMicronesiaMiddle AfricaMoldovaMoroccoNepalNetherlandsNicaraguaNigeriaNorth AmericaNorth MacedoniaNorthern AfricaNorthern EuropeNorwayOceaniaPakistanPanamaPeruPhilippinesPolandPortugalRomaniaRussiaSaudi ArabiaScotlandSenegalSerbiaSierra LeoneSingaporeSomaliaSouth AfricaSouth AmericaSouth Central AsiaSouth Eastern AsiaSouthern EuropeSpainSri LankaSt. Vincent and the GrenadinesSudanSwedenSwitzerlandSyriaTaiwanThailandTrinidad and TobagoTurkeyUgandaUkraineUruguayUzbekistanVenezuelaVietnamWest IndiesWestern AfricaWestern AsiaWestern EuropeYemenZaireZimbabweAzores
Unemployment Among Ages 16 to 19 years
Income
Poverty
Unemployment
Labor Participation
Family Structure
Vehicle Availability
Education Level
Disability

Unemployment Among Ages 16 to 19 years Comparison

Immigrants from Israel

Egyptians

Tragic
Average
18.7%
UNEMPLOYMENT AMONG AGES 16 TO 19 YEARS
0.5/ 100
METRIC RATING
247th/ 347
METRIC RANK
17.5%
UNEMPLOYMENT AMONG AGES 16 TO 19 YEARS
59.7/ 100
METRIC RATING
163rd/ 347
METRIC RANK

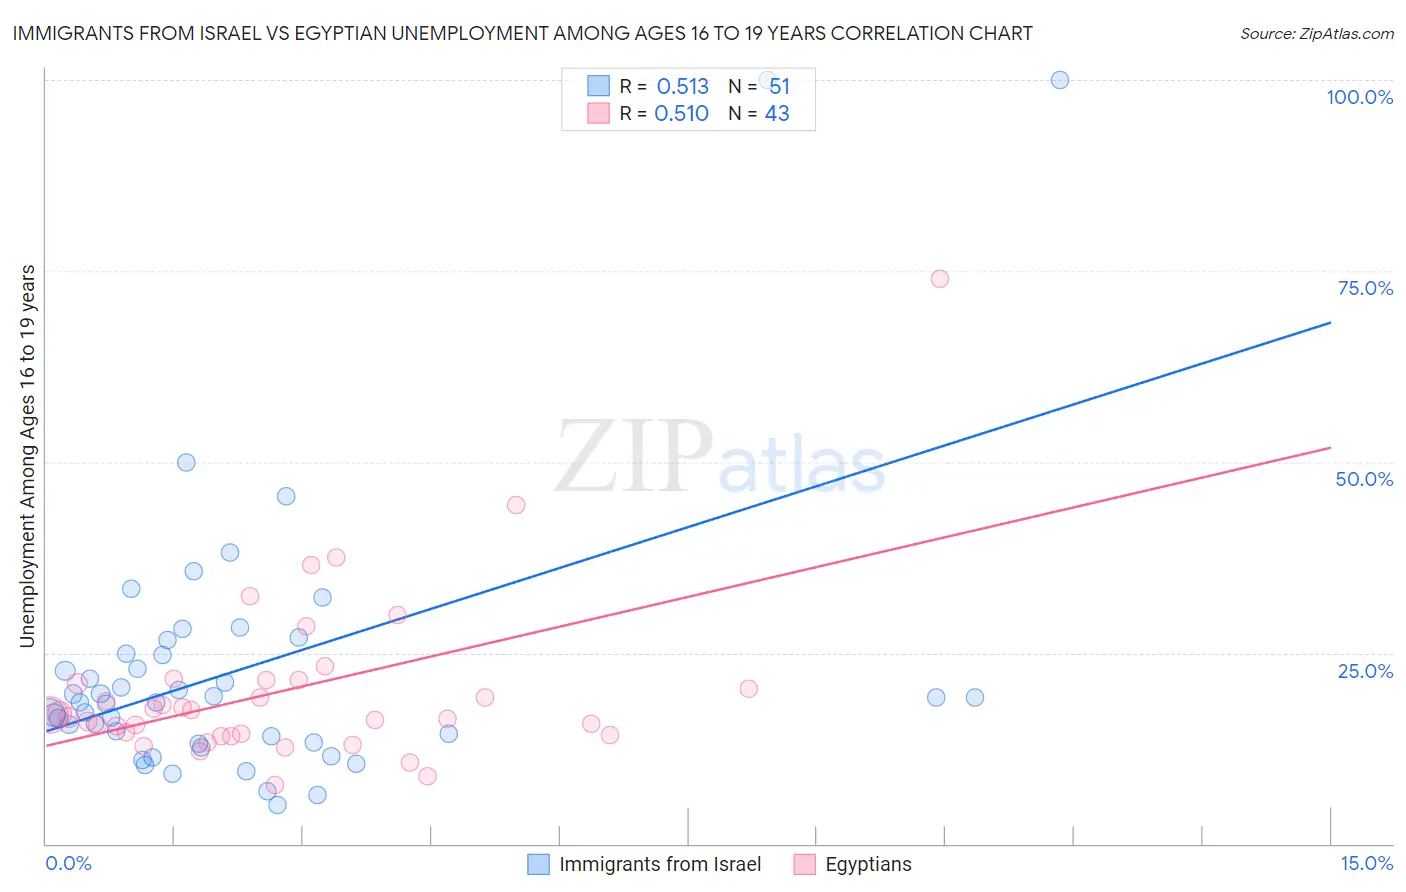
Immigrants from Israel vs Egyptian Unemployment Among Ages 16 to 19 years Correlation Chart

The statistical analysis conducted on geographies consisting of 202,743,989 people shows a substantial positive correlation between the proportion of Immigrants from Israel and unemployment rate among population between the ages 16 and 19 in the United States with a correlation coefficient (R) of 0.513 and weighted average of 18.7%. Similarly, the statistical analysis conducted on geographies consisting of 267,383,543 people shows a substantial positive correlation between the proportion of Egyptians and unemployment rate among population between the ages 16 and 19 in the United States with a correlation coefficient (R) of 0.510 and weighted average of 17.5%, a difference of 6.7%.
Immigrants from Israel vs Egyptian Unemployment Among Ages 16 to 19 years

Unemployment Among Ages 16 to 19 years Correlation Summary

MeasurementImmigrants from IsraelEgyptian
Minimum5.1%7.6%
Maximum100.0%73.9%
Range94.9%66.3%
Mean22.8%20.1%
Median18.6%16.9%
Interquartile 25% (IQ1)13.3%14.3%
Interquartile 75% (IQ3)24.8%21.4%
Interquartile Range (IQR)11.5%7.1%
Standard Deviation (Sample)18.3%11.3%
Standard Deviation (Population)18.1%11.2%

Similar Demographics by Unemployment Among Ages 16 to 19 years

Demographics Similar to Immigrants from Israel by Unemployment Among Ages 16 to 19 years

In terms of unemployment among ages 16 to 19 years, the demographic groups most similar to Immigrants from Israel are Delaware (18.7%, a difference of 0.030%), Immigrants from South America (18.7%, a difference of 0.040%), Puget Sound Salish (18.7%, a difference of 0.090%), Panamanian (18.7%, a difference of 0.20%), and Subsaharan African (18.7%, a difference of 0.31%).
DemographicsRating | RankUnemployment Among Ages 16 to 19 years
Immigrants | Cabo Verde
2.0
/100
|
#240
Tragic
18.4%
Immigrants | Ukraine
1.3
/100
|
#241
Tragic
18.5%
Moroccans
1.1
/100
|
#242
Tragic
18.5%
Mexicans
0.9
/100
|
#243
Tragic
18.5%
Guatemalans
0.8
/100
|
#244
Tragic
18.6%
Immigrants | Belarus
0.8
/100
|
#245
Tragic
18.6%
Immigrants | South America
0.5
/100
|
#246
Tragic
18.7%
Immigrants | Israel
0.5
/100
|
#247
Tragic
18.7%
Delaware
0.5
/100
|
#248
Tragic
18.7%
Puget Sound Salish
0.5
/100
|
#249
Tragic
18.7%
Panamanians
0.4
/100
|
#250
Tragic
18.7%
Sub-Saharan Africans
0.4
/100
|
#251
Tragic
18.7%
Immigrants | Guatemala
0.4
/100
|
#252
Tragic
18.7%
Central Americans
0.3
/100
|
#253
Tragic
18.8%
Apache
0.3
/100
|
#254
Tragic
18.8%

Demographics Similar to Egyptians by Unemployment Among Ages 16 to 19 years

In terms of unemployment among ages 16 to 19 years, the demographic groups most similar to Egyptians are Immigrants from Norway (17.5%, a difference of 0.0%), Immigrants from Denmark (17.5%, a difference of 0.030%), Ukrainian (17.5%, a difference of 0.040%), Korean (17.5%, a difference of 0.060%), and Immigrants from Austria (17.5%, a difference of 0.10%).
DemographicsRating | RankUnemployment Among Ages 16 to 19 years
Costa Ricans
65.9
/100
|
#156
Good
17.4%
Uruguayans
64.3
/100
|
#157
Good
17.5%
Immigrants | China
64.1
/100
|
#158
Good
17.5%
Koreans
61.0
/100
|
#159
Good
17.5%
Ukrainians
60.5
/100
|
#160
Good
17.5%
Immigrants | Denmark
60.3
/100
|
#161
Good
17.5%
Immigrants | Norway
59.8
/100
|
#162
Average
17.5%
Egyptians
59.7
/100
|
#163
Average
17.5%
Immigrants | Austria
57.7
/100
|
#164
Average
17.5%
Cape Verdeans
55.8
/100
|
#165
Average
17.5%
Immigrants | Italy
55.2
/100
|
#166
Average
17.5%
Immigrants | France
54.9
/100
|
#167
Average
17.5%
Immigrants | Hungary
54.7
/100
|
#168
Average
17.5%
Immigrants | Cambodia
54.5
/100
|
#169
Average
17.5%
Immigrants | Romania
53.3
/100
|
#170
Average
17.5%