Immigrants from Ireland vs Swedish Unemployment Among Ages 16 to 19 years

COMPARE

Immigrants from Ireland
Race
Ancestry
AfghanAfricanAlaska NativeAlaskan AthabascanAlbanianAleutAlsatianAmericanApacheArabArapahoArgentineanArmenianAssyrian/Chaldean/SyriacAustralianAustrianBahamianBangladeshiBarbadianBasqueBelgianBelizeanBermudanBhutaneseBlackfeetBolivianBrazilianBritishBritish West IndianBulgarianBurmeseCajunCambodianCanadianCape VerdeanCarpatho RusynCelticCentral AmericanCentral American IndianCherokeeCheyenneChickasawChileanChineseChippewaChoctawColombianColvilleComancheCosta RicanCreeCreekCroatianCrowCubanCypriotCzechCzechoslovakianDanishDelawareDominicanDutchDutch West IndianEastern EuropeanEcuadorianEgyptianEnglishEstonianEthiopianEuropeanFijianFilipinoFinnishFrenchFrench American IndianFrench CanadianGermanGerman RussianGhanaianGreekGuamanian/ChamorroGuatemalanGuyaneseHaitianHmongHonduranHopiHoumaHungarianIcelanderIndian (Asian)IndonesianInupiatIranianIraqiIrishIroquoisIsraeliItalianJamaicanJapaneseJordanianKenyanKiowaKoreanLaotianLatvianLebaneseLiberianLithuanianLumbeeLuxembourgerMacedonianMalaysianMalteseMarshalleseMenomineeMexicanMexican American IndianMongolianMoroccanNative HawaiianNavajoNepaleseNew ZealanderNicaraguanNigerianNorthern EuropeanNorwegianOkinawanOsageOttawaPaiutePakistaniPalestinianPanamanianParaguayanPennsylvania GermanPeruvianPimaPolishPortuguesePotawatomiPuebloPuerto RicanPuget Sound SalishRomanianRussianSalvadoranSamoanScandinavianScotch-IrishScottishSeminoleSenegaleseSerbianShoshoneSierra LeoneanSiouxSlavicSlovakSloveneSomaliSouth AfricanSouth AmericanSouth American IndianSoviet UnionSpaniardSpanishSpanish AmericanSpanish American IndianSri LankanSubsaharan AfricanSudaneseSwissSyrianTaiwaneseThaiTlingit-HaidaTohono O'OdhamTonganTrinidadian and TobagonianTsimshianTurkishU.S. Virgin IslanderUgandanUkrainianUruguayanUteVenezuelanVietnameseWelshWest IndianYakamaYaquiYugoslavianYumanYup'ikZimbabwean
Immigration
NonimmigrantsImmigrantsAfghanistanAfricaAlbaniaArgentinaArmeniaAsiaAustraliaAustriaBahamasBangladeshBarbadosBelarusBelgiumBelizeBoliviaBosnia and HerzegovinaBrazilBulgariaBurma/MyanmarCabo VerdeCambodiaCameroonCanadaCaribbeanCentral AmericaChileChinaColombiaCongoCosta RicaCroatiaCubaCzechoslovakiaDenmarkDominicaDominican RepublicEastern AfricaEastern AsiaEastern EuropeEcuadorEgyptEl SalvadorEnglandEritreaEthiopiaEuropeFijiFranceGermanyGhanaGreeceGrenadaGuatemalaGuyanaHaitiHondurasHong KongHungaryIndiaIndonesiaIranIraqIrelandIsraelItalyJamaicaJapanJordanKazakhstanKenyaKoreaKuwaitLaosLatin AmericaLatviaLebanonLiberiaLithuaniaMalaysiaMexicoMicronesiaMiddle AfricaMoldovaMoroccoNepalNetherlandsNicaraguaNigeriaNorth AmericaNorth MacedoniaNorthern AfricaNorthern EuropeNorwayOceaniaPakistanPanamaPeruPhilippinesPolandPortugalRomaniaRussiaSaudi ArabiaScotlandSenegalSerbiaSierra LeoneSingaporeSomaliaSouth AfricaSouth AmericaSouth Central AsiaSouth Eastern AsiaSouthern EuropeSpainSri LankaSt. Vincent and the GrenadinesSudanSwedenSwitzerlandSyriaTaiwanThailandTrinidad and TobagoTurkeyUgandaUkraineUruguayUzbekistanVenezuelaVietnamWest IndiesWestern AfricaWestern AsiaWestern EuropeYemenZaireZimbabweAzores
Swedish
Race
Ancestry
AfghanAfricanAlaska NativeAlaskan AthabascanAlbanianAleutAlsatianAmericanApacheArabArapahoArgentineanArmenianAssyrian/Chaldean/SyriacAustralianAustrianBahamianBangladeshiBarbadianBasqueBelgianBelizeanBermudanBhutaneseBlackfeetBolivianBrazilianBritishBritish West IndianBulgarianBurmeseCajunCambodianCanadianCape VerdeanCarpatho RusynCelticCentral AmericanCentral American IndianCherokeeCheyenneChickasawChileanChineseChippewaChoctawColombianColvilleComancheCosta RicanCreeCreekCroatianCrowCubanCypriotCzechCzechoslovakianDanishDelawareDominicanDutchDutch West IndianEastern EuropeanEcuadorianEgyptianEnglishEstonianEthiopianEuropeanFijianFilipinoFinnishFrenchFrench American IndianFrench CanadianGermanGerman RussianGhanaianGreekGuamanian/ChamorroGuatemalanGuyaneseHaitianHmongHonduranHopiHoumaHungarianIcelanderIndian (Asian)IndonesianInupiatIranianIraqiIrishIroquoisIsraeliItalianJamaicanJapaneseJordanianKenyanKiowaKoreanLaotianLatvianLebaneseLiberianLithuanianLumbeeLuxembourgerMacedonianMalaysianMalteseMarshalleseMenomineeMexicanMexican American IndianMongolianMoroccanNative HawaiianNavajoNepaleseNew ZealanderNicaraguanNigerianNorthern EuropeanNorwegianOkinawanOsageOttawaPaiutePakistaniPalestinianPanamanianParaguayanPennsylvania GermanPeruvianPimaPolishPortuguesePotawatomiPuebloPuerto RicanPuget Sound SalishRomanianRussianSalvadoranSamoanScandinavianScotch-IrishScottishSeminoleSenegaleseSerbianShoshoneSierra LeoneanSiouxSlavicSlovakSloveneSomaliSouth AfricanSouth AmericanSouth American IndianSoviet UnionSpaniardSpanishSpanish AmericanSpanish American IndianSri LankanSubsaharan AfricanSudaneseSwedishSwissSyrianTaiwaneseThaiTlingit-HaidaTohono O'OdhamTonganTrinidadian and TobagonianTsimshianTurkishU.S. Virgin IslanderUgandanUkrainianUruguayanUteVenezuelanVietnameseWelshWest IndianYakamaYaquiYugoslavianYumanYup'ikZimbabwean
Immigration
NonimmigrantsImmigrantsAfghanistanAfricaAlbaniaArgentinaArmeniaAsiaAustraliaAustriaBahamasBangladeshBarbadosBelarusBelgiumBelizeBoliviaBosnia and HerzegovinaBrazilBulgariaBurma/MyanmarCabo VerdeCambodiaCameroonCanadaCaribbeanCentral AmericaChileChinaColombiaCongoCosta RicaCroatiaCubaCzechoslovakiaDenmarkDominicaDominican RepublicEastern AfricaEastern AsiaEastern EuropeEcuadorEgyptEl SalvadorEnglandEritreaEthiopiaEuropeFijiFranceGermanyGhanaGreeceGrenadaGuatemalaGuyanaHaitiHondurasHong KongHungaryIndiaIndonesiaIranIraqIsraelItalyJamaicaJapanJordanKazakhstanKenyaKoreaKuwaitLaosLatin AmericaLatviaLebanonLiberiaLithuaniaMalaysiaMexicoMicronesiaMiddle AfricaMoldovaMoroccoNepalNetherlandsNicaraguaNigeriaNorth AmericaNorth MacedoniaNorthern AfricaNorthern EuropeNorwayOceaniaPakistanPanamaPeruPhilippinesPolandPortugalRomaniaRussiaSaudi ArabiaScotlandSenegalSerbiaSierra LeoneSingaporeSomaliaSouth AfricaSouth AmericaSouth Central AsiaSouth Eastern AsiaSouthern EuropeSpainSri LankaSt. Vincent and the GrenadinesSudanSwedenSwitzerlandSyriaTaiwanThailandTrinidad and TobagoTurkeyUgandaUkraineUruguayUzbekistanVenezuelaVietnamWest IndiesWestern AfricaWestern AsiaWestern EuropeYemenZaireZimbabweAzores
Unemployment Among Ages 16 to 19 years
Income
Poverty
Unemployment
Labor Participation
Family Structure
Vehicle Availability
Education Level
Disability

Unemployment Among Ages 16 to 19 years Comparison

Immigrants from Ireland

Swedes

Fair
Exceptional
17.8%
UNEMPLOYMENT AMONG AGES 16 TO 19 YEARS
28.5/ 100
METRIC RATING
199th/ 347
METRIC RANK
15.3%
UNEMPLOYMENT AMONG AGES 16 TO 19 YEARS
100.0/ 100
METRIC RATING
6th/ 347
METRIC RANK

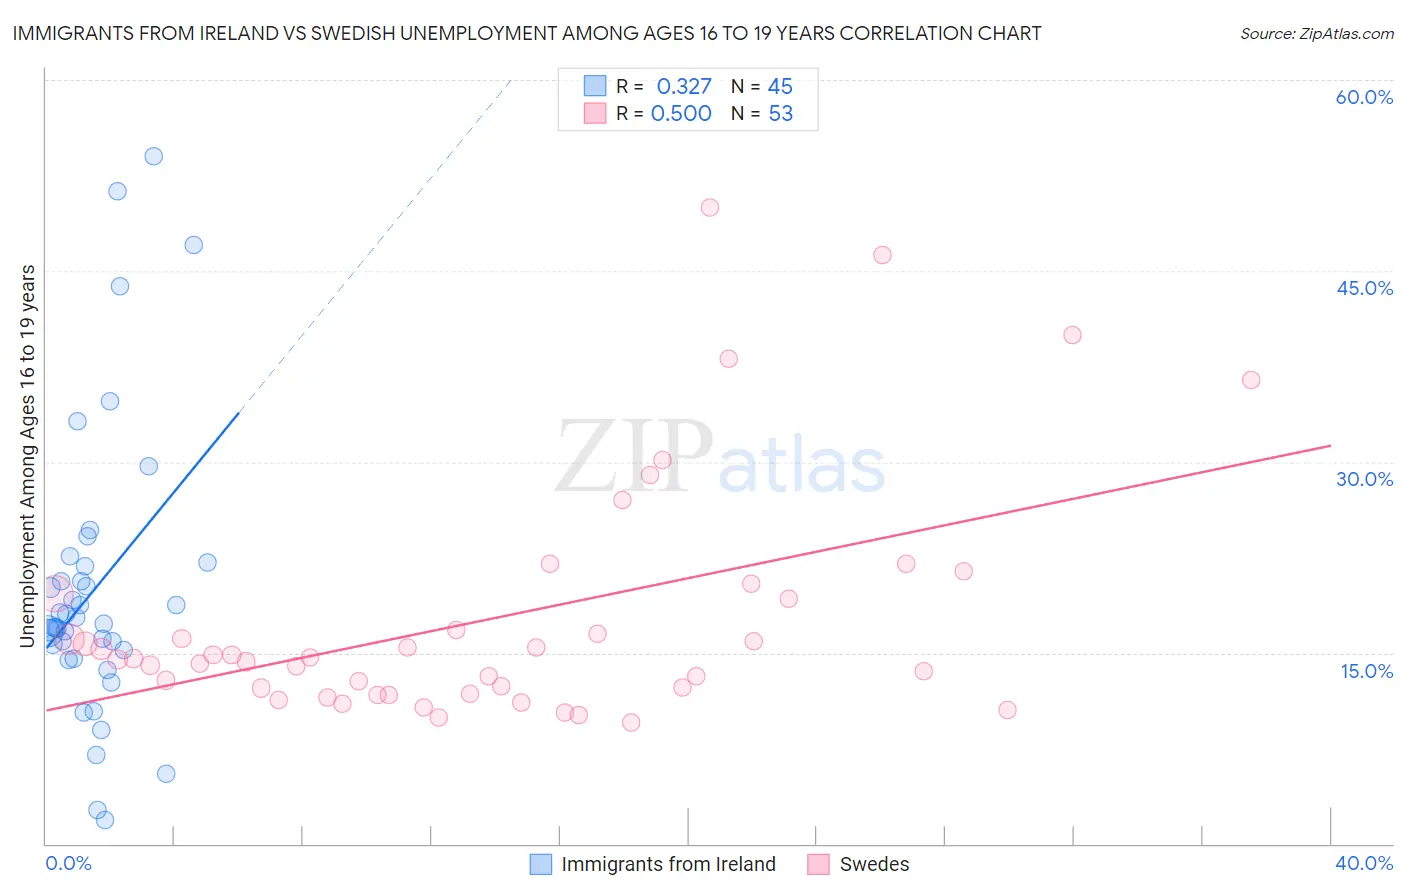
Immigrants from Ireland vs Swedish Unemployment Among Ages 16 to 19 years Correlation Chart

The statistical analysis conducted on geographies consisting of 230,161,155 people shows a mild positive correlation between the proportion of Immigrants from Ireland and unemployment rate among population between the ages 16 and 19 in the United States with a correlation coefficient (R) of 0.327 and weighted average of 17.8%. Similarly, the statistical analysis conducted on geographies consisting of 486,284,600 people shows a moderate positive correlation between the proportion of Swedes and unemployment rate among population between the ages 16 and 19 in the United States with a correlation coefficient (R) of 0.500 and weighted average of 15.3%, a difference of 16.0%.
Immigrants from Ireland vs Swedish Unemployment Among Ages 16 to 19 years

Unemployment Among Ages 16 to 19 years Correlation Summary

MeasurementImmigrants from IrelandSwedish
Minimum1.9%9.5%
Maximum54.0%50.0%
Range52.1%40.5%
Mean20.0%17.7%
Median17.3%14.5%
Interquartile 25% (IQ1)14.9%12.0%
Interquartile 75% (IQ3)21.9%19.5%
Interquartile Range (IQR)7.1%7.5%
Standard Deviation (Sample)11.3%9.3%
Standard Deviation (Population)11.2%9.2%

Similar Demographics by Unemployment Among Ages 16 to 19 years

Demographics Similar to Immigrants from Ireland by Unemployment Among Ages 16 to 19 years

In terms of unemployment among ages 16 to 19 years, the demographic groups most similar to Immigrants from Ireland are Immigrants from Fiji (17.8%, a difference of 0.050%), Ethiopian (17.8%, a difference of 0.060%), Immigrants from Czechoslovakia (17.8%, a difference of 0.070%), Immigrants from Ethiopia (17.8%, a difference of 0.070%), and Immigrants from Portugal (17.8%, a difference of 0.080%).
DemographicsRating | RankUnemployment Among Ages 16 to 19 years
Immigrants | Philippines
40.7
/100
|
#192
Average
17.7%
Immigrants | Australia
40.6
/100
|
#193
Average
17.7%
Peruvians
38.8
/100
|
#194
Fair
17.7%
Immigrants | Peru
37.3
/100
|
#195
Fair
17.7%
Alaskan Athabascans
34.1
/100
|
#196
Fair
17.7%
Immigrants | Czechoslovakia
29.8
/100
|
#197
Fair
17.8%
Ethiopians
29.6
/100
|
#198
Fair
17.8%
Immigrants | Ireland
28.5
/100
|
#199
Fair
17.8%
Immigrants | Fiji
27.7
/100
|
#200
Fair
17.8%
Immigrants | Ethiopia
27.4
/100
|
#201
Fair
17.8%
Immigrants | Portugal
27.2
/100
|
#202
Fair
17.8%
Immigrants | Eastern Europe
23.6
/100
|
#203
Fair
17.8%
Immigrants | Nonimmigrants
20.9
/100
|
#204
Fair
17.9%
Assyrians/Chaldeans/Syriacs
20.8
/100
|
#205
Fair
17.9%
Immigrants | Southern Europe
18.9
/100
|
#206
Poor
17.9%

Demographics Similar to Swedes by Unemployment Among Ages 16 to 19 years

In terms of unemployment among ages 16 to 19 years, the demographic groups most similar to Swedes are Immigrants from Bosnia and Herzegovina (15.3%, a difference of 0.17%), Immigrants from Somalia (15.3%, a difference of 0.27%), Czech (15.4%, a difference of 0.41%), Scandinavian (15.4%, a difference of 0.74%), and Zimbabwean (15.4%, a difference of 0.86%).
DemographicsRating | RankUnemployment Among Ages 16 to 19 years
Norwegians
100.0
/100
|
#1
Exceptional
14.5%
Immigrants | India
100.0
/100
|
#2
Exceptional
15.0%
Luxembourgers
100.0
/100
|
#3
Exceptional
15.1%
Danes
100.0
/100
|
#4
Exceptional
15.2%
Immigrants | Somalia
100.0
/100
|
#5
Exceptional
15.3%
Swedes
100.0
/100
|
#6
Exceptional
15.3%
Immigrants | Bosnia and Herzegovina
100.0
/100
|
#7
Exceptional
15.3%
Czechs
100.0
/100
|
#8
Exceptional
15.4%
Scandinavians
100.0
/100
|
#9
Exceptional
15.4%
Zimbabweans
100.0
/100
|
#10
Exceptional
15.4%
Indonesians
100.0
/100
|
#11
Exceptional
15.5%
Taiwanese
100.0
/100
|
#12
Exceptional
15.5%
Immigrants | Burma/Myanmar
100.0
/100
|
#13
Exceptional
15.6%
Immigrants | Zaire
100.0
/100
|
#14
Exceptional
15.6%
Yugoslavians
100.0
/100
|
#15
Exceptional
15.6%