Immigrants from Ireland vs Seminole Unemployment Among Seniors over 75 years
COMPARE
Immigrants from Ireland
Seminole
Unemployment Among Seniors over 75 years
Unemployment Among Seniors over 75 years Comparison
Immigrants from Ireland
Seminole
8.1%
UNEMPLOYMENT AMONG SENIORS OVER 75 YEARS
99.4/ 100
METRIC RATING
94th/ 347
METRIC RANK
7.1%
UNEMPLOYMENT AMONG SENIORS OVER 75 YEARS
100.0/ 100
METRIC RATING
16th/ 347
METRIC RANK
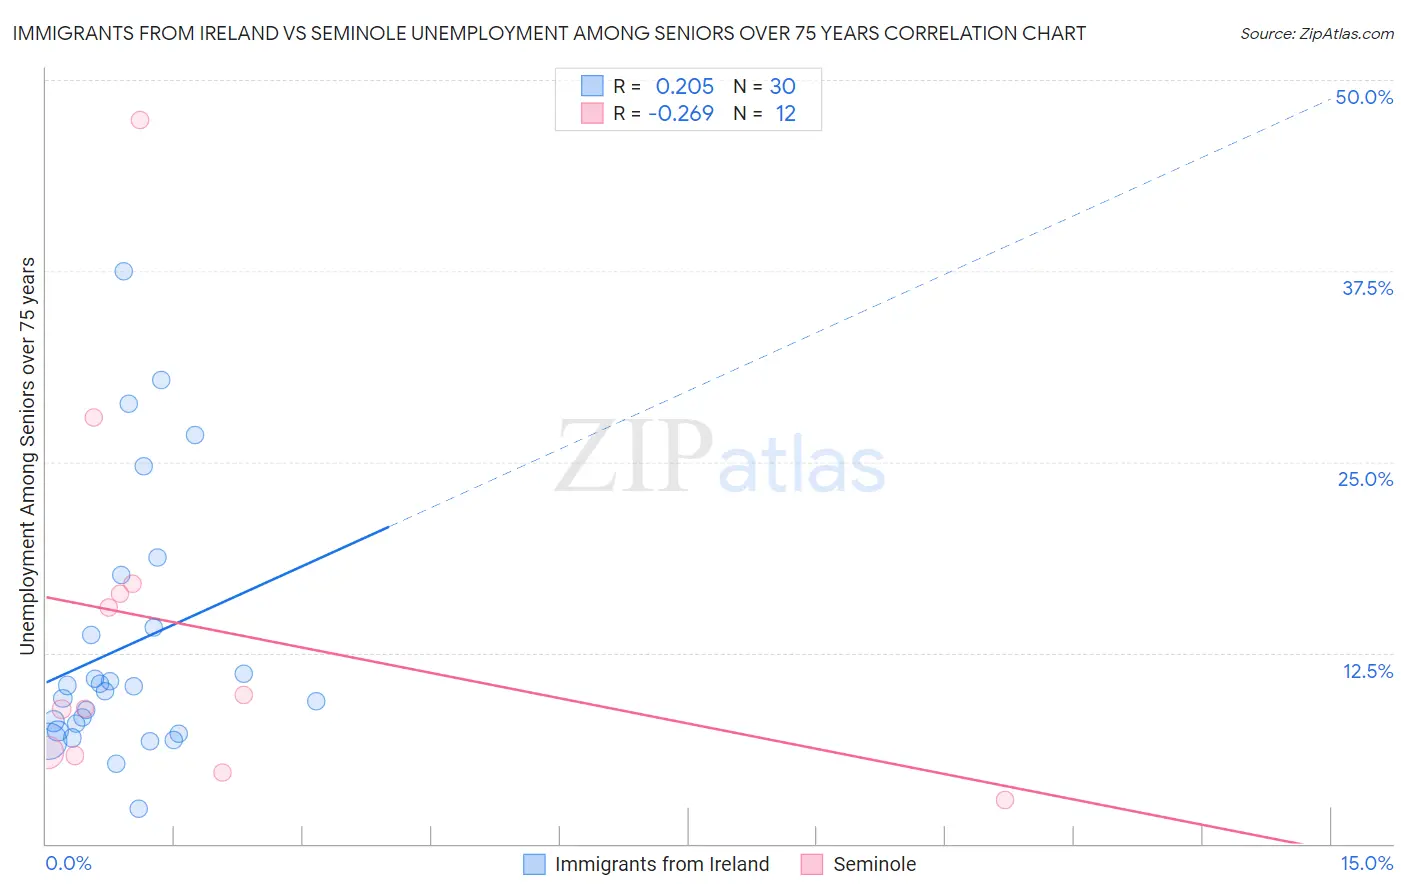
Immigrants from Ireland vs Seminole Unemployment Among Seniors over 75 years Correlation Chart
The statistical analysis conducted on geographies consisting of 151,026,698 people shows a weak positive correlation between the proportion of Immigrants from Ireland and unemployment rate among seniors over the age of 75 in the United States with a correlation coefficient (R) of 0.205 and weighted average of 8.1%. Similarly, the statistical analysis conducted on geographies consisting of 85,658,042 people shows a weak negative correlation between the proportion of Seminole and unemployment rate among seniors over the age of 75 in the United States with a correlation coefficient (R) of -0.269 and weighted average of 7.1%, a difference of 14.3%.
Unemployment Among Seniors over 75 years Correlation Summary
| Measurement | Immigrants from Ireland | Seminole |
| Minimum | 2.3% | 2.9% |
| Maximum | 37.5% | 47.4% |
| Range | 35.2% | 44.5% |
| Mean | 12.9% | 14.2% |
| Median | 10.2% | 9.3% |
| Interquartile 25% (IQ1) | 7.4% | 5.9% |
| Interquartile 75% (IQ3) | 14.2% | 16.7% |
| Interquartile Range (IQR) | 6.8% | 10.8% |
| Standard Deviation (Sample) | 8.5% | 12.6% |
| Standard Deviation (Population) | 8.4% | 12.0% |
Similar Demographics by Unemployment Among Seniors over 75 years
Demographics Similar to Immigrants from Ireland by Unemployment Among Seniors over 75 years
In terms of unemployment among seniors over 75 years, the demographic groups most similar to Immigrants from Ireland are Immigrants from Netherlands (8.1%, a difference of 0.030%), Venezuelan (8.1%, a difference of 0.11%), Egyptian (8.1%, a difference of 0.12%), Immigrants from Vietnam (8.1%, a difference of 0.16%), and Immigrants from Korea (8.1%, a difference of 0.24%).
| Demographics | Rating | Rank | Unemployment Among Seniors over 75 years |
| Basques | 99.5 /100 | #87 | Exceptional 8.1% |
| New Zealanders | 99.5 /100 | #88 | Exceptional 8.1% |
| Immigrants | Korea | 99.5 /100 | #89 | Exceptional 8.1% |
| Immigrants | Vietnam | 99.5 /100 | #90 | Exceptional 8.1% |
| Egyptians | 99.5 /100 | #91 | Exceptional 8.1% |
| Venezuelans | 99.5 /100 | #92 | Exceptional 8.1% |
| Immigrants | Netherlands | 99.5 /100 | #93 | Exceptional 8.1% |
| Immigrants | Ireland | 99.4 /100 | #94 | Exceptional 8.1% |
| Nicaraguans | 99.3 /100 | #95 | Exceptional 8.2% |
| Immigrants | Belgium | 99.3 /100 | #96 | Exceptional 8.2% |
| Immigrants | Sri Lanka | 99.3 /100 | #97 | Exceptional 8.2% |
| Immigrants | Northern Africa | 99.3 /100 | #98 | Exceptional 8.2% |
| Burmese | 99.2 /100 | #99 | Exceptional 8.2% |
| Immigrants | Kazakhstan | 99.2 /100 | #100 | Exceptional 8.2% |
| Immigrants | Serbia | 99.2 /100 | #101 | Exceptional 8.2% |
Demographics Similar to Seminole by Unemployment Among Seniors over 75 years
In terms of unemployment among seniors over 75 years, the demographic groups most similar to Seminole are Immigrants from Switzerland (7.2%, a difference of 1.0%), Icelander (7.0%, a difference of 1.3%), Immigrants from Uzbekistan (7.2%, a difference of 1.3%), Immigrants from Zaire (7.2%, a difference of 1.4%), and Armenian (7.2%, a difference of 1.8%).
| Demographics | Rating | Rank | Unemployment Among Seniors over 75 years |
| Soviet Union | 100.0 /100 | #9 | Exceptional 6.6% |
| Yuman | 100.0 /100 | #10 | Exceptional 6.7% |
| Immigrants | Grenada | 100.0 /100 | #11 | Exceptional 6.7% |
| Comanche | 100.0 /100 | #12 | Exceptional 6.7% |
| Immigrants | Congo | 100.0 /100 | #13 | Exceptional 6.7% |
| Ute | 100.0 /100 | #14 | Exceptional 6.8% |
| Icelanders | 100.0 /100 | #15 | Exceptional 7.0% |
| Seminole | 100.0 /100 | #16 | Exceptional 7.1% |
| Immigrants | Switzerland | 100.0 /100 | #17 | Exceptional 7.2% |
| Immigrants | Uzbekistan | 100.0 /100 | #18 | Exceptional 7.2% |
| Immigrants | Zaire | 100.0 /100 | #19 | Exceptional 7.2% |
| Armenians | 100.0 /100 | #20 | Exceptional 7.2% |
| Chickasaw | 100.0 /100 | #21 | Exceptional 7.3% |
| Cypriots | 100.0 /100 | #22 | Exceptional 7.4% |
| Israelis | 100.0 /100 | #23 | Exceptional 7.4% |