Immigrants from Iraq vs Yugoslavian Unemployment Among Seniors over 75 years
COMPARE
Immigrants from Iraq
Yugoslavian
Unemployment Among Seniors over 75 years
Unemployment Among Seniors over 75 years Comparison
Immigrants from Iraq
Yugoslavians
9.4%
UNEMPLOYMENT AMONG SENIORS OVER 75 YEARS
0.3/ 100
METRIC RATING
272nd/ 347
METRIC RANK
9.1%
UNEMPLOYMENT AMONG SENIORS OVER 75 YEARS
4.8/ 100
METRIC RATING
233rd/ 347
METRIC RANK
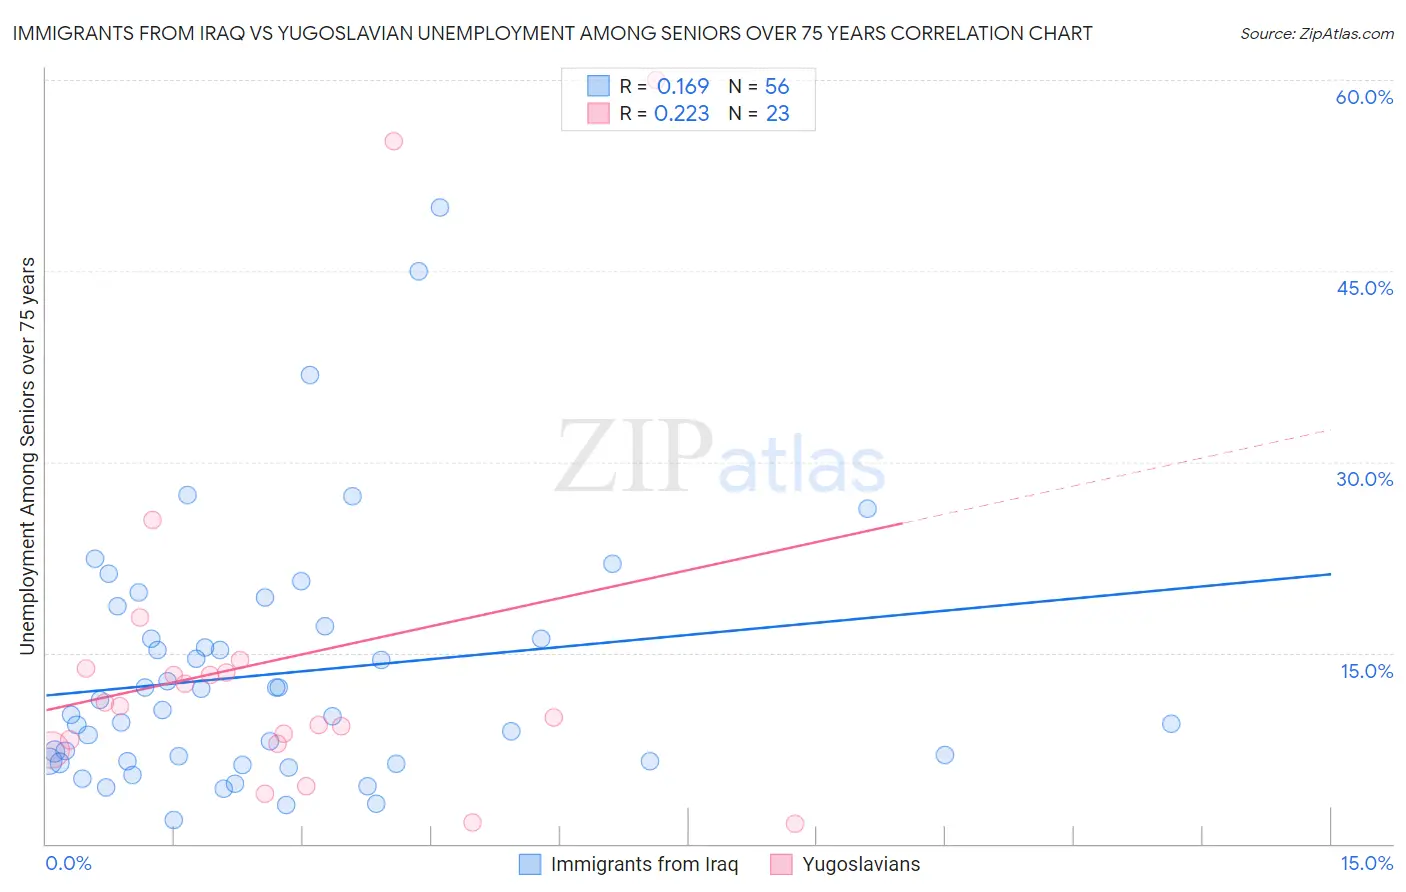
Immigrants from Iraq vs Yugoslavian Unemployment Among Seniors over 75 years Correlation Chart
The statistical analysis conducted on geographies consisting of 126,739,961 people shows a poor positive correlation between the proportion of Immigrants from Iraq and unemployment rate among seniors over the age of 75 in the United States with a correlation coefficient (R) of 0.169 and weighted average of 9.4%. Similarly, the statistical analysis conducted on geographies consisting of 163,293,100 people shows a weak positive correlation between the proportion of Yugoslavians and unemployment rate among seniors over the age of 75 in the United States with a correlation coefficient (R) of 0.223 and weighted average of 9.1%, a difference of 3.7%.
Unemployment Among Seniors over 75 years Correlation Summary
| Measurement | Immigrants from Iraq | Yugoslavian |
| Minimum | 1.8% | 1.6% |
| Maximum | 50.0% | 60.0% |
| Range | 48.2% | 58.4% |
| Mean | 13.3% | 14.5% |
| Median | 10.3% | 10.8% |
| Interquartile 25% (IQ1) | 6.5% | 7.8% |
| Interquartile 75% (IQ3) | 16.6% | 13.8% |
| Interquartile Range (IQR) | 10.1% | 5.9% |
| Standard Deviation (Sample) | 9.8% | 14.6% |
| Standard Deviation (Population) | 9.7% | 14.3% |
Similar Demographics by Unemployment Among Seniors over 75 years
Demographics Similar to Immigrants from Iraq by Unemployment Among Seniors over 75 years
In terms of unemployment among seniors over 75 years, the demographic groups most similar to Immigrants from Iraq are Bulgarian (9.4%, a difference of 0.030%), Yaqui (9.4%, a difference of 0.11%), Czechoslovakian (9.4%, a difference of 0.14%), Puerto Rican (9.4%, a difference of 0.20%), and Jamaican (9.5%, a difference of 0.26%).
| Demographics | Rating | Rank | Unemployment Among Seniors over 75 years |
| Palestinians | 0.6 /100 | #265 | Tragic 9.3% |
| Blacks/African Americans | 0.5 /100 | #266 | Tragic 9.4% |
| Immigrants | Mexico | 0.4 /100 | #267 | Tragic 9.4% |
| Greeks | 0.4 /100 | #268 | Tragic 9.4% |
| Puerto Ricans | 0.3 /100 | #269 | Tragic 9.4% |
| Yaqui | 0.3 /100 | #270 | Tragic 9.4% |
| Bulgarians | 0.3 /100 | #271 | Tragic 9.4% |
| Immigrants | Iraq | 0.3 /100 | #272 | Tragic 9.4% |
| Czechoslovakians | 0.3 /100 | #273 | Tragic 9.4% |
| Jamaicans | 0.2 /100 | #274 | Tragic 9.5% |
| Senegalese | 0.2 /100 | #275 | Tragic 9.5% |
| Arabs | 0.2 /100 | #276 | Tragic 9.5% |
| Swiss | 0.1 /100 | #277 | Tragic 9.5% |
| Immigrants | Senegal | 0.1 /100 | #278 | Tragic 9.6% |
| British | 0.1 /100 | #279 | Tragic 9.6% |
Demographics Similar to Yugoslavians by Unemployment Among Seniors over 75 years
In terms of unemployment among seniors over 75 years, the demographic groups most similar to Yugoslavians are African (9.1%, a difference of 0.020%), Northern European (9.1%, a difference of 0.040%), Immigrants from Central America (9.1%, a difference of 0.040%), Hispanic or Latino (9.1%, a difference of 0.050%), and Vietnamese (9.1%, a difference of 0.050%).
| Demographics | Rating | Rank | Unemployment Among Seniors over 75 years |
| Immigrants | Bangladesh | 5.9 /100 | #226 | Tragic 9.1% |
| Samoans | 5.7 /100 | #227 | Tragic 9.1% |
| Kenyans | 5.4 /100 | #228 | Tragic 9.1% |
| Hispanics or Latinos | 5.0 /100 | #229 | Tragic 9.1% |
| Northern Europeans | 4.9 /100 | #230 | Tragic 9.1% |
| Immigrants | Central America | 4.9 /100 | #231 | Tragic 9.1% |
| Africans | 4.9 /100 | #232 | Tragic 9.1% |
| Yugoslavians | 4.8 /100 | #233 | Tragic 9.1% |
| Vietnamese | 4.6 /100 | #234 | Tragic 9.1% |
| Panamanians | 4.0 /100 | #235 | Tragic 9.1% |
| Jordanians | 4.0 /100 | #236 | Tragic 9.1% |
| Houma | 3.9 /100 | #237 | Tragic 9.1% |
| Inupiat | 3.6 /100 | #238 | Tragic 9.1% |
| Mexicans | 3.5 /100 | #239 | Tragic 9.1% |
| Spanish | 3.3 /100 | #240 | Tragic 9.1% |