Immigrants from Iran vs Sri Lankan Unemployment Among Ages 60 to 64 years
COMPARE
Immigrants from Iran
Sri Lankan
Unemployment Among Ages 60 to 64 years
Unemployment Among Ages 60 to 64 years Comparison
Immigrants from Iran
Sri Lankans
5.1%
UNEMPLOYMENT AMONG AGES 60 TO 64 YEARS
0.1/ 100
METRIC RATING
270th/ 347
METRIC RANK
4.9%
UNEMPLOYMENT AMONG AGES 60 TO 64 YEARS
39.8/ 100
METRIC RATING
182nd/ 347
METRIC RANK
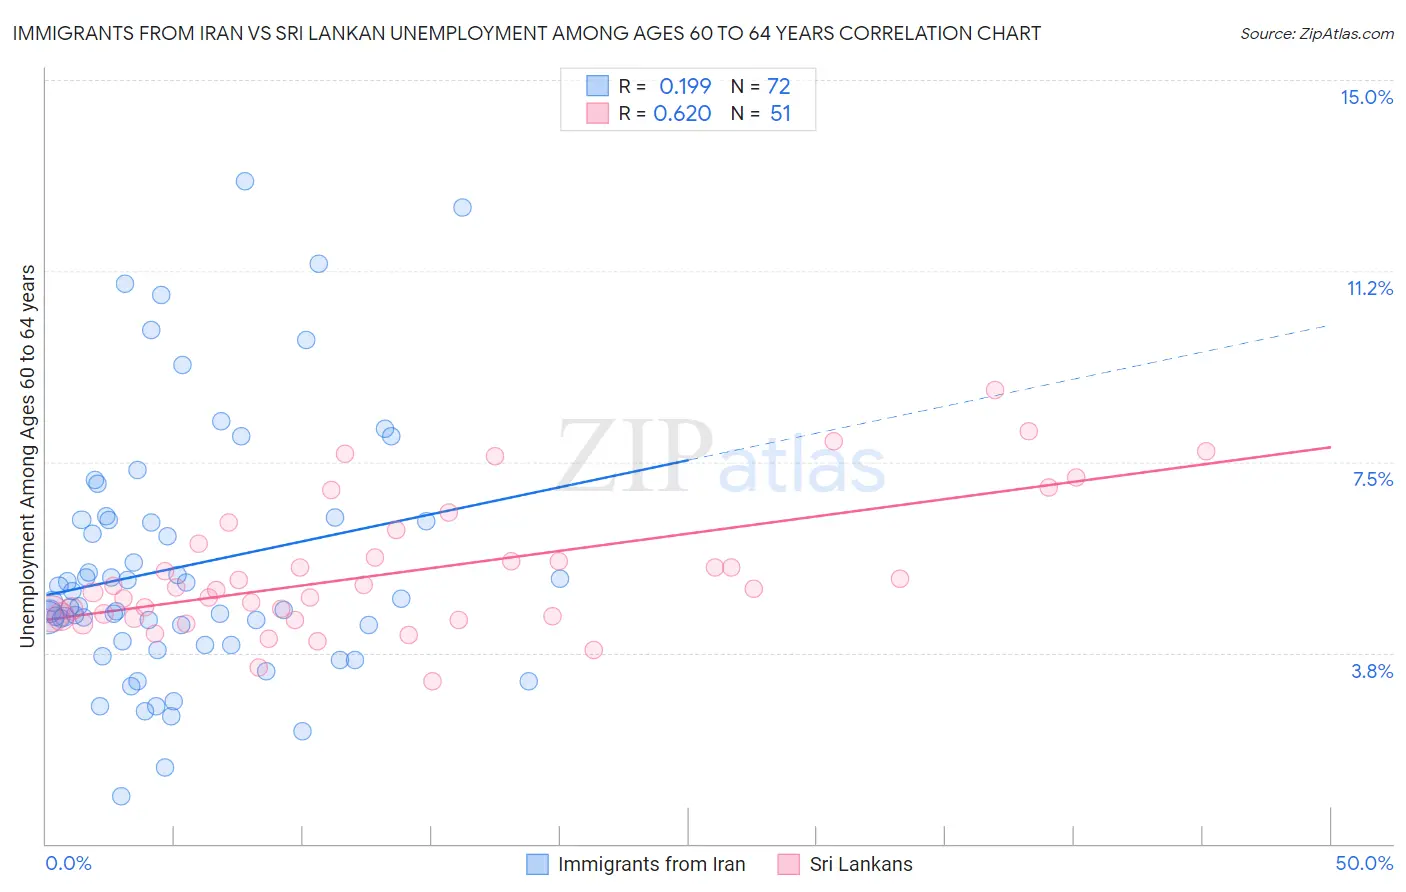
Immigrants from Iran vs Sri Lankan Unemployment Among Ages 60 to 64 years Correlation Chart
The statistical analysis conducted on geographies consisting of 263,348,174 people shows a poor positive correlation between the proportion of Immigrants from Iran and unemployment rate among population between the ages 60 and 64 in the United States with a correlation coefficient (R) of 0.199 and weighted average of 5.1%. Similarly, the statistical analysis conducted on geographies consisting of 393,788,798 people shows a significant positive correlation between the proportion of Sri Lankans and unemployment rate among population between the ages 60 and 64 in the United States with a correlation coefficient (R) of 0.620 and weighted average of 4.9%, a difference of 5.6%.
Unemployment Among Ages 60 to 64 years Correlation Summary
| Measurement | Immigrants from Iran | Sri Lankan |
| Minimum | 0.93% | 3.2% |
| Maximum | 13.0% | 8.9% |
| Range | 12.1% | 5.7% |
| Mean | 5.5% | 5.3% |
| Median | 4.7% | 5.0% |
| Interquartile 25% (IQ1) | 3.9% | 4.5% |
| Interquartile 75% (IQ3) | 6.4% | 5.9% |
| Interquartile Range (IQR) | 2.4% | 1.4% |
| Standard Deviation (Sample) | 2.5% | 1.3% |
| Standard Deviation (Population) | 2.5% | 1.3% |
Similar Demographics by Unemployment Among Ages 60 to 64 years
Demographics Similar to Immigrants from Iran by Unemployment Among Ages 60 to 64 years
In terms of unemployment among ages 60 to 64 years, the demographic groups most similar to Immigrants from Iran are Israeli (5.2%, a difference of 0.27%), Haitian (5.2%, a difference of 0.30%), Immigrants from Costa Rica (5.1%, a difference of 0.31%), Central American Indian (5.1%, a difference of 0.35%), and Immigrants from Spain (5.2%, a difference of 0.37%).
| Demographics | Rating | Rank | Unemployment Among Ages 60 to 64 years |
| Immigrants | Immigrants | 0.4 /100 | #263 | Tragic 5.1% |
| Sioux | 0.3 /100 | #264 | Tragic 5.1% |
| Immigrants | Argentina | 0.2 /100 | #265 | Tragic 5.1% |
| Immigrants | Australia | 0.2 /100 | #266 | Tragic 5.1% |
| Immigrants | Bahamas | 0.2 /100 | #267 | Tragic 5.1% |
| Central American Indians | 0.2 /100 | #268 | Tragic 5.1% |
| Immigrants | Costa Rica | 0.2 /100 | #269 | Tragic 5.1% |
| Immigrants | Iran | 0.1 /100 | #270 | Tragic 5.1% |
| Israelis | 0.1 /100 | #271 | Tragic 5.2% |
| Haitians | 0.1 /100 | #272 | Tragic 5.2% |
| Immigrants | Spain | 0.1 /100 | #273 | Tragic 5.2% |
| Hopi | 0.1 /100 | #274 | Tragic 5.2% |
| Immigrants | Hong Kong | 0.1 /100 | #275 | Tragic 5.2% |
| Central Americans | 0.0 /100 | #276 | Tragic 5.2% |
| Immigrants | Caribbean | 0.0 /100 | #277 | Tragic 5.2% |
Demographics Similar to Sri Lankans by Unemployment Among Ages 60 to 64 years
In terms of unemployment among ages 60 to 64 years, the demographic groups most similar to Sri Lankans are Hungarian (4.9%, a difference of 0.030%), Subsaharan African (4.9%, a difference of 0.030%), Asian (4.9%, a difference of 0.040%), Immigrants from Ukraine (4.9%, a difference of 0.080%), and Ute (4.9%, a difference of 0.090%).
| Demographics | Rating | Rank | Unemployment Among Ages 60 to 64 years |
| Immigrants | Latvia | 46.9 /100 | #175 | Average 4.9% |
| Bermudans | 46.5 /100 | #176 | Average 4.9% |
| Immigrants | Malaysia | 44.7 /100 | #177 | Average 4.9% |
| Immigrants | Nonimmigrants | 44.5 /100 | #178 | Average 4.9% |
| Immigrants | Sweden | 44.3 /100 | #179 | Average 4.9% |
| Asians | 40.8 /100 | #180 | Average 4.9% |
| Hungarians | 40.6 /100 | #181 | Average 4.9% |
| Sri Lankans | 39.8 /100 | #182 | Fair 4.9% |
| Sub-Saharan Africans | 38.9 /100 | #183 | Fair 4.9% |
| Immigrants | Ukraine | 37.6 /100 | #184 | Fair 4.9% |
| Ute | 37.4 /100 | #185 | Fair 4.9% |
| Spaniards | 35.8 /100 | #186 | Fair 4.9% |
| South American Indians | 31.2 /100 | #187 | Fair 4.9% |
| Nicaraguans | 30.4 /100 | #188 | Fair 4.9% |
| Immigrants | Nicaragua | 29.8 /100 | #189 | Fair 4.9% |