Immigrants from Iran vs Immigrants from Honduras Female Unemployment
COMPARE
Immigrants from Iran
Immigrants from Honduras
Female Unemployment
Female Unemployment Comparison
Immigrants from Iran
Immigrants from Honduras
5.5%
FEMALE UNEMPLOYMENT
3.3/ 100
METRIC RATING
235th/ 347
METRIC RANK
5.9%
FEMALE UNEMPLOYMENT
0.0/ 100
METRIC RATING
270th/ 347
METRIC RANK
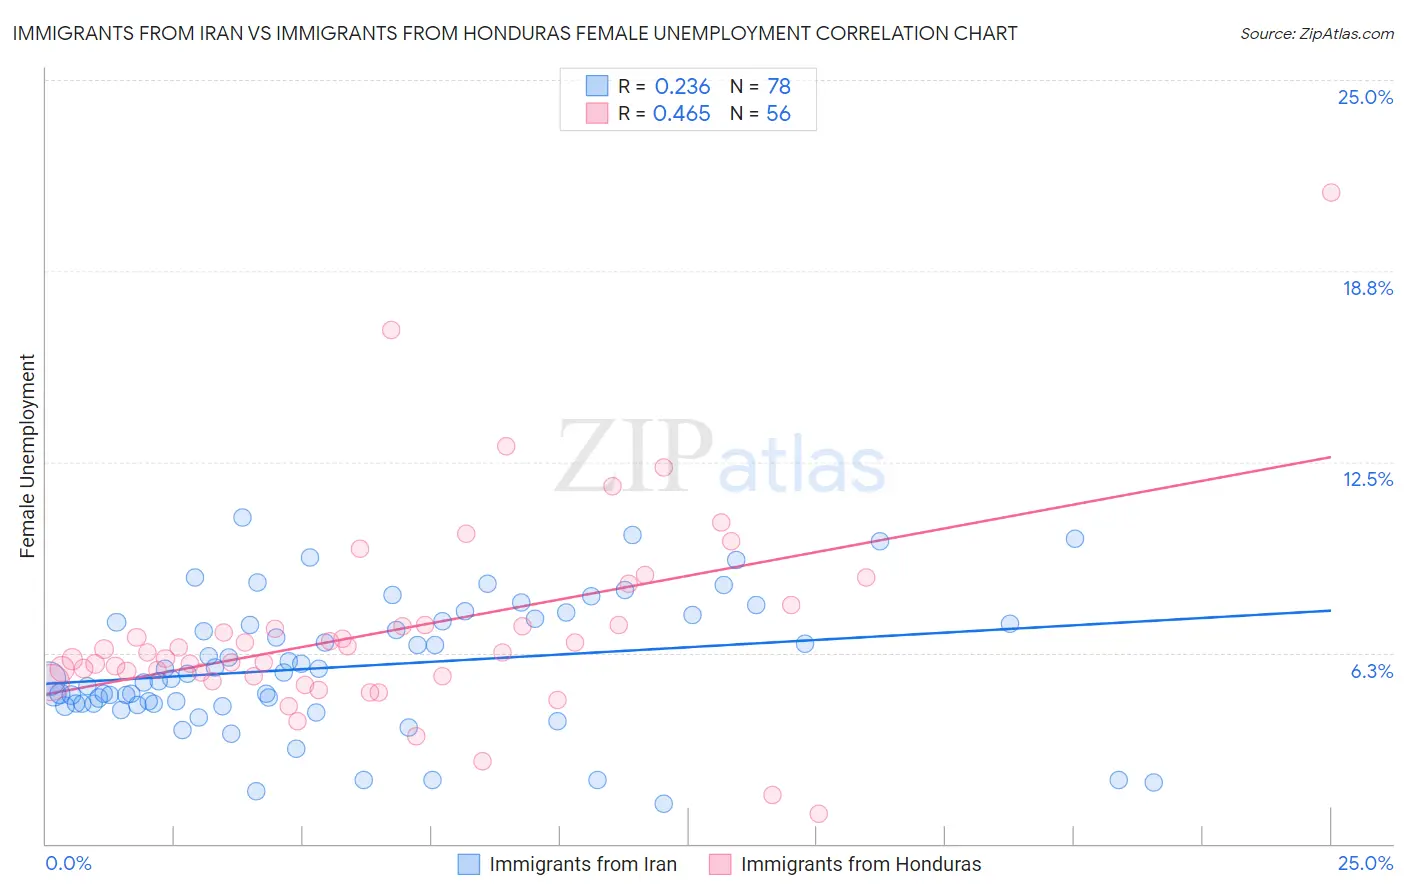
Immigrants from Iran vs Immigrants from Honduras Female Unemployment Correlation Chart
The statistical analysis conducted on geographies consisting of 279,353,147 people shows a weak positive correlation between the proportion of Immigrants from Iran and unemploymnet rate among females in the United States with a correlation coefficient (R) of 0.236 and weighted average of 5.5%. Similarly, the statistical analysis conducted on geographies consisting of 321,601,293 people shows a moderate positive correlation between the proportion of Immigrants from Honduras and unemploymnet rate among females in the United States with a correlation coefficient (R) of 0.465 and weighted average of 5.9%, a difference of 7.3%.
Female Unemployment Correlation Summary
| Measurement | Immigrants from Iran | Immigrants from Honduras |
| Minimum | 1.3% | 1.0% |
| Maximum | 10.7% | 21.3% |
| Range | 9.4% | 20.3% |
| Mean | 5.8% | 7.0% |
| Median | 5.5% | 6.3% |
| Interquartile 25% (IQ1) | 4.6% | 5.5% |
| Interquartile 75% (IQ3) | 7.3% | 7.1% |
| Interquartile Range (IQR) | 2.7% | 1.6% |
| Standard Deviation (Sample) | 2.1% | 3.3% |
| Standard Deviation (Population) | 2.1% | 3.3% |
Similar Demographics by Female Unemployment
Demographics Similar to Immigrants from Iran by Female Unemployment
In terms of female unemployment, the demographic groups most similar to Immigrants from Iran are Immigrants from Lebanon (5.5%, a difference of 0.0%), Moroccan (5.5%, a difference of 0.030%), Immigrants from Cambodia (5.5%, a difference of 0.030%), Immigrants from Panama (5.5%, a difference of 0.060%), and Sierra Leonean (5.5%, a difference of 0.080%).
| Demographics | Rating | Rank | Female Unemployment |
| Israelis | 4.8 /100 | #228 | Tragic 5.5% |
| Panamanians | 4.7 /100 | #229 | Tragic 5.5% |
| Immigrants | Uruguay | 4.7 /100 | #230 | Tragic 5.5% |
| Immigrants | Iraq | 3.9 /100 | #231 | Tragic 5.5% |
| Liberians | 3.9 /100 | #232 | Tragic 5.5% |
| Moroccans | 3.4 /100 | #233 | Tragic 5.5% |
| Immigrants | Lebanon | 3.3 /100 | #234 | Tragic 5.5% |
| Immigrants | Iran | 3.3 /100 | #235 | Tragic 5.5% |
| Immigrants | Cambodia | 3.3 /100 | #236 | Tragic 5.5% |
| Immigrants | Panama | 3.2 /100 | #237 | Tragic 5.5% |
| Sierra Leoneans | 3.2 /100 | #238 | Tragic 5.5% |
| Aleuts | 3.0 /100 | #239 | Tragic 5.5% |
| Immigrants | South America | 2.9 /100 | #240 | Tragic 5.5% |
| South American Indians | 2.8 /100 | #241 | Tragic 5.5% |
| Marshallese | 2.3 /100 | #242 | Tragic 5.6% |
Demographics Similar to Immigrants from Honduras by Female Unemployment
In terms of female unemployment, the demographic groups most similar to Immigrants from Honduras are Central American (5.9%, a difference of 0.10%), Lumbee (5.9%, a difference of 0.29%), Ghanaian (5.9%, a difference of 0.30%), African (5.9%, a difference of 0.38%), and Immigrants from Western Africa (5.9%, a difference of 0.41%).
| Demographics | Rating | Rank | Female Unemployment |
| Immigrants | Azores | 0.1 /100 | #263 | Tragic 5.8% |
| Immigrants | Bahamas | 0.1 /100 | #264 | Tragic 5.8% |
| Blackfeet | 0.0 /100 | #265 | Tragic 5.9% |
| Cape Verdeans | 0.0 /100 | #266 | Tragic 5.9% |
| Nepalese | 0.0 /100 | #267 | Tragic 5.9% |
| Hondurans | 0.0 /100 | #268 | Tragic 5.9% |
| Immigrants | Western Africa | 0.0 /100 | #269 | Tragic 5.9% |
| Immigrants | Honduras | 0.0 /100 | #270 | Tragic 5.9% |
| Central Americans | 0.0 /100 | #271 | Tragic 5.9% |
| Lumbee | 0.0 /100 | #272 | Tragic 5.9% |
| Ghanaians | 0.0 /100 | #273 | Tragic 5.9% |
| Africans | 0.0 /100 | #274 | Tragic 5.9% |
| Senegalese | 0.0 /100 | #275 | Tragic 6.0% |
| Bahamians | 0.0 /100 | #276 | Tragic 6.0% |
| Immigrants | Ghana | 0.0 /100 | #277 | Tragic 6.0% |