Immigrants from Indonesia vs Alaskan Athabascan Unemployment Among Youth under 25 years

COMPARE

Immigrants from Indonesia
Race
Ancestry
AfghanAfricanAlaska NativeAlbanianAleutAlsatianAmericanApacheArabArapahoArgentineanArmenianAssyrian/Chaldean/SyriacAustralianAustrianBahamianBangladeshiBarbadianBasqueBelgianBelizeanBermudanBhutaneseBlackfeetBolivianBrazilianBritishBritish West IndianBulgarianBurmeseCajunCambodianCanadianCape VerdeanCarpatho RusynCelticCentral AmericanCentral American IndianCherokeeCheyenneChickasawChileanChineseChippewaChoctawColombianColvilleComancheCosta RicanCreeCreekCroatianCrowCubanCypriotCzechCzechoslovakianDanishDelawareDominicanDutchDutch West IndianEastern EuropeanEcuadorianEgyptianEnglishEstonianEthiopianEuropeanFijianFilipinoFinnishFrenchFrench American IndianFrench CanadianGermanGerman RussianGhanaianGreekGuamanian/ChamorroGuatemalanGuyaneseHaitianHmongHonduranHopiHoumaHungarianIcelanderIndian (Asian)IndonesianInupiatIranianIraqiIrishIroquoisIsraeliItalianJamaicanJapaneseJordanianKenyanKiowaKoreanLaotianLatvianLebaneseLiberianLithuanianLumbeeLuxembourgerMacedonianMalaysianMalteseMarshalleseMenomineeMexicanMexican American IndianMongolianMoroccanNative HawaiianNavajoNepaleseNew ZealanderNicaraguanNigerianNorthern EuropeanNorwegianOkinawanOsageOttawaPaiutePakistaniPalestinianPanamanianParaguayanPennsylvania GermanPeruvianPimaPolishPortuguesePotawatomiPuebloPuerto RicanPuget Sound SalishRomanianRussianSalvadoranSamoanScandinavianScotch-IrishScottishSeminoleSenegaleseSerbianShoshoneSierra LeoneanSiouxSlavicSlovakSloveneSomaliSouth AfricanSouth AmericanSouth American IndianSoviet UnionSpaniardSpanishSpanish AmericanSpanish American IndianSri LankanSubsaharan AfricanSudaneseSwedishSwissSyrianTaiwaneseThaiTlingit-HaidaTohono O'OdhamTonganTrinidadian and TobagonianTsimshianTurkishU.S. Virgin IslanderUgandanUkrainianUruguayanUteVenezuelanVietnameseWelshWest IndianYakamaYaquiYugoslavianYumanYup'ikZimbabwean
Immigration
NonimmigrantsImmigrantsAfghanistanAfricaAlbaniaArgentinaArmeniaAsiaAustraliaAustriaBahamasBangladeshBarbadosBelarusBelgiumBelizeBoliviaBosnia and HerzegovinaBrazilBulgariaBurma/MyanmarCabo VerdeCambodiaCameroonCanadaCaribbeanCentral AmericaChileChinaColombiaCongoCosta RicaCroatiaCubaCzechoslovakiaDenmarkDominicaDominican RepublicEastern AfricaEastern AsiaEastern EuropeEcuadorEgyptEl SalvadorEnglandEritreaEthiopiaEuropeFijiFranceGermanyGhanaGreeceGrenadaGuatemalaGuyanaHaitiHondurasHong KongHungaryIndiaIndonesiaIranIraqIrelandIsraelItalyJamaicaJapanJordanKazakhstanKenyaKoreaKuwaitLaosLatin AmericaLatviaLebanonLiberiaLithuaniaMalaysiaMexicoMicronesiaMiddle AfricaMoldovaMoroccoNepalNetherlandsNicaraguaNigeriaNorth AmericaNorth MacedoniaNorthern AfricaNorthern EuropeNorwayOceaniaPakistanPanamaPeruPhilippinesPolandPortugalRomaniaRussiaSaudi ArabiaScotlandSenegalSerbiaSierra LeoneSingaporeSomaliaSouth AfricaSouth AmericaSouth Central AsiaSouth Eastern AsiaSouthern EuropeSpainSri LankaSt. Vincent and the GrenadinesSudanSwedenSwitzerlandSyriaTaiwanThailandTrinidad and TobagoTurkeyUgandaUkraineUruguayUzbekistanVenezuelaVietnamWest IndiesWestern AfricaWestern AsiaWestern EuropeYemenZaireZimbabweAzores
Alaskan Athabascan
Race
Ancestry
AfghanAfricanAlaska NativeAlaskan AthabascanAlbanianAleutAlsatianAmericanApacheArabArapahoArgentineanArmenianAssyrian/Chaldean/SyriacAustralianAustrianBahamianBangladeshiBarbadianBasqueBelgianBelizeanBermudanBhutaneseBlackfeetBolivianBrazilianBritishBritish West IndianBulgarianBurmeseCajunCambodianCanadianCape VerdeanCarpatho RusynCelticCentral AmericanCentral American IndianCherokeeCheyenneChickasawChileanChineseChippewaChoctawColombianColvilleComancheCosta RicanCreeCreekCroatianCrowCubanCypriotCzechCzechoslovakianDanishDelawareDominicanDutchDutch West IndianEastern EuropeanEcuadorianEgyptianEnglishEstonianEthiopianEuropeanFijianFilipinoFinnishFrenchFrench American IndianFrench CanadianGermanGerman RussianGhanaianGreekGuamanian/ChamorroGuatemalanGuyaneseHaitianHmongHonduranHopiHoumaHungarianIcelanderIndian (Asian)IndonesianInupiatIranianIraqiIrishIroquoisIsraeliItalianJamaicanJapaneseJordanianKenyanKiowaKoreanLaotianLatvianLebaneseLiberianLithuanianLumbeeLuxembourgerMacedonianMalaysianMalteseMarshalleseMenomineeMexicanMexican American IndianMongolianMoroccanNative HawaiianNavajoNepaleseNew ZealanderNicaraguanNigerianNorthern EuropeanNorwegianOkinawanOsageOttawaPaiutePakistaniPalestinianPanamanianParaguayanPennsylvania GermanPeruvianPimaPolishPortuguesePotawatomiPuebloPuerto RicanPuget Sound SalishRomanianRussianSalvadoranSamoanScandinavianScotch-IrishScottishSeminoleSenegaleseSerbianShoshoneSierra LeoneanSiouxSlavicSlovakSloveneSomaliSouth AfricanSouth AmericanSouth American IndianSoviet UnionSpaniardSpanishSpanish AmericanSpanish American IndianSri LankanSubsaharan AfricanSudaneseSwedishSwissSyrianTaiwaneseThaiTlingit-HaidaTohono O'OdhamTonganTrinidadian and TobagonianTsimshianTurkishU.S. Virgin IslanderUgandanUkrainianUruguayanUteVenezuelanVietnameseWelshWest IndianYakamaYaquiYugoslavianYumanYup'ikZimbabwean
Immigration
NonimmigrantsImmigrantsAfghanistanAfricaAlbaniaArgentinaArmeniaAsiaAustraliaAustriaBahamasBangladeshBarbadosBelarusBelgiumBelizeBoliviaBosnia and HerzegovinaBrazilBulgariaBurma/MyanmarCabo VerdeCambodiaCameroonCanadaCaribbeanCentral AmericaChileChinaColombiaCongoCosta RicaCroatiaCubaCzechoslovakiaDenmarkDominicaDominican RepublicEastern AfricaEastern AsiaEastern EuropeEcuadorEgyptEl SalvadorEnglandEritreaEthiopiaEuropeFijiFranceGermanyGhanaGreeceGrenadaGuatemalaGuyanaHaitiHondurasHong KongHungaryIndiaIranIraqIrelandIsraelItalyJamaicaJapanJordanKazakhstanKenyaKoreaKuwaitLaosLatin AmericaLatviaLebanonLiberiaLithuaniaMalaysiaMexicoMicronesiaMiddle AfricaMoldovaMoroccoNepalNetherlandsNicaraguaNigeriaNorth AmericaNorth MacedoniaNorthern AfricaNorthern EuropeNorwayOceaniaPakistanPanamaPeruPhilippinesPolandPortugalRomaniaRussiaSaudi ArabiaScotlandSenegalSerbiaSierra LeoneSingaporeSomaliaSouth AfricaSouth AmericaSouth Central AsiaSouth Eastern AsiaSouthern EuropeSpainSri LankaSt. Vincent and the GrenadinesSudanSwedenSwitzerlandSyriaTaiwanThailandTrinidad and TobagoTurkeyUgandaUkraineUruguayUzbekistanVenezuelaVietnamWest IndiesWestern AfricaWestern AsiaWestern EuropeYemenZaireZimbabweAzores
Unemployment Among Youth under 25 years
Income
Poverty
Unemployment
Labor Participation
Family Structure
Vehicle Availability
Education Level
Disability

Unemployment Among Youth under 25 years Comparison

Immigrants from Indonesia

Alaskan Athabascans

Good
Tragic
11.5%
UNEMPLOYMENT AMONG YOUTH UNDER 25 YEARS
77.6/ 100
METRIC RATING
139th/ 347
METRIC RANK
12.2%
UNEMPLOYMENT AMONG YOUTH UNDER 25 YEARS
0.6/ 100
METRIC RATING
244th/ 347
METRIC RANK

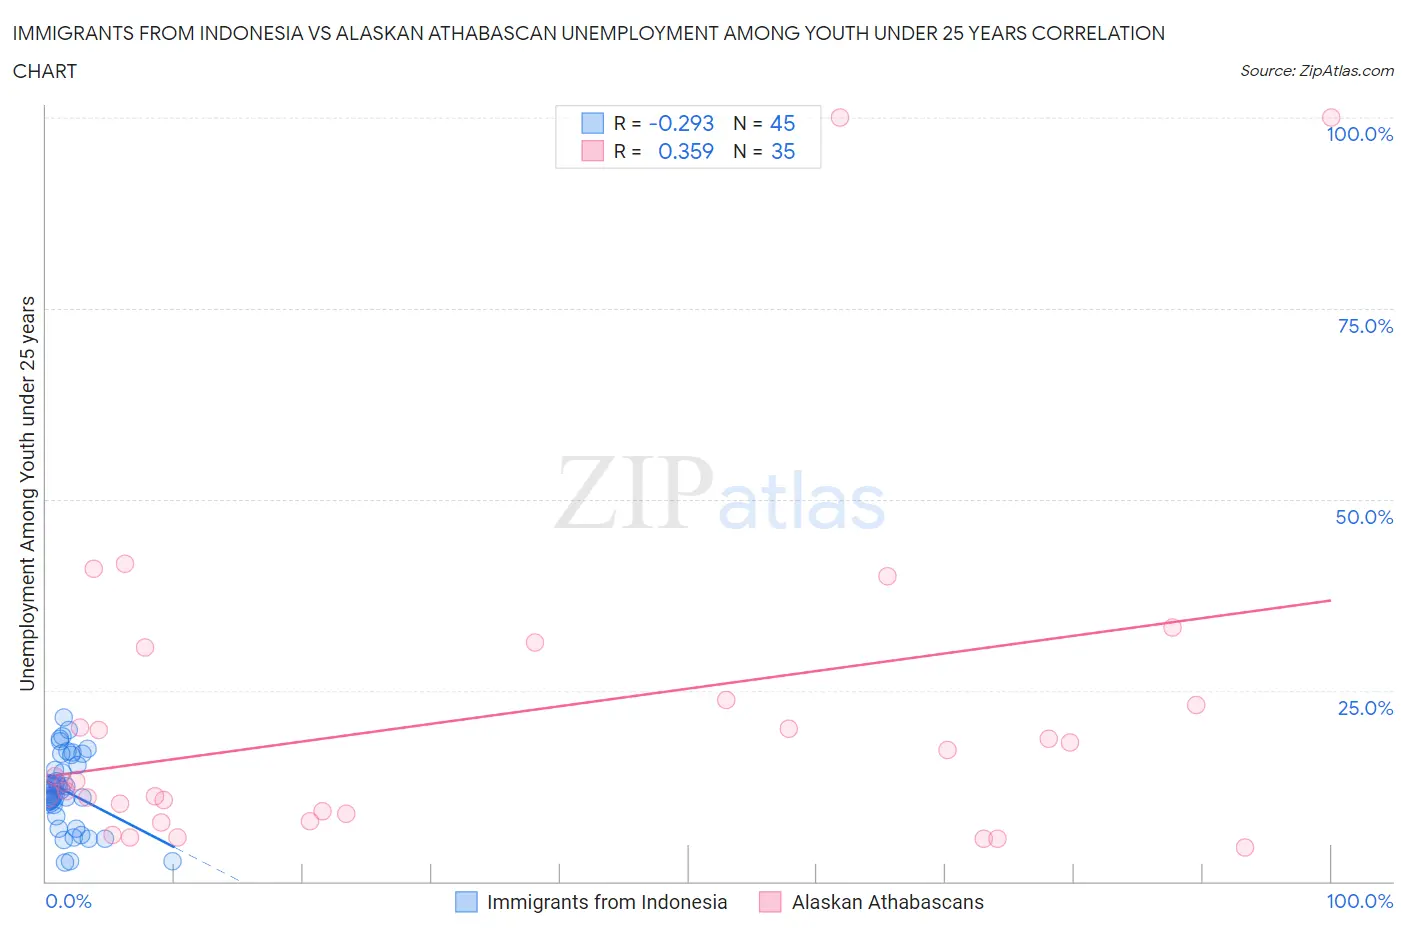
Immigrants from Indonesia vs Alaskan Athabascan Unemployment Among Youth under 25 years Correlation Chart

The statistical analysis conducted on geographies consisting of 214,867,001 people shows a weak negative correlation between the proportion of Immigrants from Indonesia and unemployment rate among youth under the age of 25 in the United States with a correlation coefficient (R) of -0.293 and weighted average of 11.5%. Similarly, the statistical analysis conducted on geographies consisting of 45,575,744 people shows a mild positive correlation between the proportion of Alaskan Athabascans and unemployment rate among youth under the age of 25 in the United States with a correlation coefficient (R) of 0.359 and weighted average of 12.2%, a difference of 6.5%.
Immigrants from Indonesia vs Alaskan Athabascan Unemployment Among Youth under 25 years

Unemployment Among Youth under 25 years Correlation Summary

MeasurementImmigrants from IndonesiaAlaskan Athabascan
Minimum2.4%4.5%
Maximum21.5%100.0%
Range19.1%95.5%
Mean11.8%21.4%
Median11.6%13.1%
Interquartile 25% (IQ1)9.3%8.8%
Interquartile 75% (IQ3)15.9%23.8%
Interquartile Range (IQR)6.6%15.0%
Standard Deviation (Sample)4.8%22.3%
Standard Deviation (Population)4.7%22.0%

Similar Demographics by Unemployment Among Youth under 25 years

Demographics Similar to Immigrants from Indonesia by Unemployment Among Youth under 25 years

In terms of unemployment among youth under 25 years, the demographic groups most similar to Immigrants from Indonesia are Immigrants from Belgium (11.5%, a difference of 0.010%), Immigrants from England (11.5%, a difference of 0.030%), Immigrants from Uruguay (11.5%, a difference of 0.090%), Asian (11.4%, a difference of 0.13%), and Immigrants from Korea (11.5%, a difference of 0.14%).
DemographicsRating | RankUnemployment Among Youth under 25 years
Ethiopians
83.2
/100
|
#132
Excellent
11.4%
Lebanese
83.1
/100
|
#133
Excellent
11.4%
Immigrants | Chile
80.4
/100
|
#134
Excellent
11.4%
Immigrants | Oceania
80.2
/100
|
#135
Excellent
11.4%
Romanians
80.1
/100
|
#136
Excellent
11.4%
Asians
79.7
/100
|
#137
Good
11.4%
Immigrants | England
78.1
/100
|
#138
Good
11.5%
Immigrants | Indonesia
77.6
/100
|
#139
Good
11.5%
Immigrants | Belgium
77.5
/100
|
#140
Good
11.5%
Immigrants | Uruguay
76.1
/100
|
#141
Good
11.5%
Immigrants | Korea
75.1
/100
|
#142
Good
11.5%
Immigrants | Uganda
74.5
/100
|
#143
Good
11.5%
Immigrants | Brazil
74.3
/100
|
#144
Good
11.5%
Argentineans
73.0
/100
|
#145
Good
11.5%
Brazilians
72.5
/100
|
#146
Good
11.5%

Demographics Similar to Alaskan Athabascans by Unemployment Among Youth under 25 years

In terms of unemployment among youth under 25 years, the demographic groups most similar to Alaskan Athabascans are Immigrants from the Azores (12.2%, a difference of 0.0%), Spanish American (12.2%, a difference of 0.010%), Immigrants from Honduras (12.2%, a difference of 0.010%), Immigrants from Greece (12.2%, a difference of 0.12%), and Central American (12.2%, a difference of 0.14%).
DemographicsRating | RankUnemployment Among Youth under 25 years
Native Hawaiians
1.3
/100
|
#237
Tragic
12.1%
Albanians
1.2
/100
|
#238
Tragic
12.1%
Immigrants | Africa
1.1
/100
|
#239
Tragic
12.1%
Dutch West Indians
1.1
/100
|
#240
Tragic
12.1%
Immigrants | Albania
1.1
/100
|
#241
Tragic
12.1%
Immigrants | Western Asia
0.8
/100
|
#242
Tragic
12.2%
Immigrants | Azores
0.6
/100
|
#243
Tragic
12.2%
Alaskan Athabascans
0.6
/100
|
#244
Tragic
12.2%
Spanish Americans
0.6
/100
|
#245
Tragic
12.2%
Immigrants | Honduras
0.6
/100
|
#246
Tragic
12.2%
Immigrants | Greece
0.6
/100
|
#247
Tragic
12.2%
Central Americans
0.6
/100
|
#248
Tragic
12.2%
Soviet Union
0.6
/100
|
#249
Tragic
12.2%
Delaware
0.4
/100
|
#250
Tragic
12.3%
Mexican American Indians
0.4
/100
|
#251
Tragic
12.3%