Immigrants from India vs Immigrants from Spain Unemployment Among Youth under 25 years

COMPARE

Immigrants from India
Race
Ancestry
AfghanAfricanAlaska NativeAlaskan AthabascanAlbanianAleutAlsatianAmericanApacheArabArapahoArgentineanArmenianAssyrian/Chaldean/SyriacAustralianAustrianBahamianBangladeshiBarbadianBasqueBelgianBelizeanBermudanBhutaneseBlackfeetBolivianBrazilianBritishBritish West IndianBulgarianBurmeseCajunCambodianCanadianCape VerdeanCarpatho RusynCelticCentral AmericanCentral American IndianCherokeeCheyenneChickasawChileanChineseChippewaChoctawColombianColvilleComancheCosta RicanCreeCreekCroatianCrowCubanCypriotCzechCzechoslovakianDanishDelawareDominicanDutchDutch West IndianEastern EuropeanEcuadorianEgyptianEnglishEstonianEthiopianEuropeanFijianFilipinoFinnishFrenchFrench American IndianFrench CanadianGermanGerman RussianGhanaianGreekGuamanian/ChamorroGuatemalanGuyaneseHaitianHmongHonduranHopiHoumaHungarianIcelanderIndian (Asian)IndonesianInupiatIranianIraqiIrishIroquoisIsraeliItalianJamaicanJapaneseJordanianKenyanKiowaKoreanLaotianLatvianLebaneseLiberianLithuanianLumbeeLuxembourgerMacedonianMalaysianMalteseMarshalleseMenomineeMexicanMexican American IndianMongolianMoroccanNative HawaiianNavajoNepaleseNew ZealanderNicaraguanNigerianNorthern EuropeanNorwegianOkinawanOsageOttawaPaiutePakistaniPalestinianPanamanianParaguayanPennsylvania GermanPeruvianPimaPolishPortuguesePotawatomiPuebloPuerto RicanPuget Sound SalishRomanianRussianSalvadoranSamoanScandinavianScotch-IrishScottishSeminoleSenegaleseSerbianShoshoneSierra LeoneanSiouxSlavicSlovakSloveneSomaliSouth AfricanSouth AmericanSouth American IndianSoviet UnionSpaniardSpanishSpanish AmericanSpanish American IndianSri LankanSubsaharan AfricanSudaneseSwedishSwissSyrianTaiwaneseThaiTlingit-HaidaTohono O'OdhamTonganTrinidadian and TobagonianTsimshianTurkishU.S. Virgin IslanderUgandanUkrainianUruguayanUteVenezuelanVietnameseWelshWest IndianYakamaYaquiYugoslavianYumanYup'ikZimbabwean
Immigration
NonimmigrantsImmigrantsAfghanistanAfricaAlbaniaArgentinaArmeniaAsiaAustraliaAustriaBahamasBangladeshBarbadosBelarusBelgiumBelizeBoliviaBosnia and HerzegovinaBrazilBulgariaBurma/MyanmarCabo VerdeCambodiaCameroonCanadaCaribbeanCentral AmericaChileChinaColombiaCongoCosta RicaCroatiaCubaCzechoslovakiaDenmarkDominicaDominican RepublicEastern AfricaEastern AsiaEastern EuropeEcuadorEgyptEl SalvadorEnglandEritreaEthiopiaEuropeFijiFranceGermanyGhanaGreeceGrenadaGuatemalaGuyanaHaitiHondurasHong KongHungaryIndiaIndonesiaIranIraqIrelandIsraelItalyJamaicaJapanJordanKazakhstanKenyaKoreaKuwaitLaosLatin AmericaLatviaLebanonLiberiaLithuaniaMalaysiaMexicoMicronesiaMiddle AfricaMoldovaMoroccoNepalNetherlandsNicaraguaNigeriaNorth AmericaNorth MacedoniaNorthern AfricaNorthern EuropeNorwayOceaniaPakistanPanamaPeruPhilippinesPolandPortugalRomaniaRussiaSaudi ArabiaScotlandSenegalSerbiaSierra LeoneSingaporeSomaliaSouth AfricaSouth AmericaSouth Central AsiaSouth Eastern AsiaSouthern EuropeSri LankaSt. Vincent and the GrenadinesSudanSwedenSwitzerlandSyriaTaiwanThailandTrinidad and TobagoTurkeyUgandaUkraineUruguayUzbekistanVenezuelaVietnamWest IndiesWestern AfricaWestern AsiaWestern EuropeYemenZaireZimbabweAzores
Immigrants from Spain
Race
Ancestry
AfghanAfricanAlaska NativeAlaskan AthabascanAlbanianAleutAlsatianAmericanApacheArabArapahoArgentineanArmenianAssyrian/Chaldean/SyriacAustralianAustrianBahamianBangladeshiBarbadianBasqueBelgianBelizeanBermudanBhutaneseBlackfeetBolivianBrazilianBritishBritish West IndianBulgarianBurmeseCajunCambodianCanadianCape VerdeanCarpatho RusynCelticCentral AmericanCentral American IndianCherokeeCheyenneChickasawChileanChineseChippewaChoctawColombianColvilleComancheCosta RicanCreeCreekCroatianCrowCubanCypriotCzechCzechoslovakianDanishDelawareDominicanDutchDutch West IndianEastern EuropeanEcuadorianEgyptianEnglishEstonianEthiopianEuropeanFijianFilipinoFinnishFrenchFrench American IndianFrench CanadianGermanGerman RussianGhanaianGreekGuamanian/ChamorroGuatemalanGuyaneseHaitianHmongHonduranHopiHoumaHungarianIcelanderIndian (Asian)IndonesianInupiatIranianIraqiIrishIroquoisIsraeliItalianJamaicanJapaneseJordanianKenyanKiowaKoreanLaotianLatvianLebaneseLiberianLithuanianLumbeeLuxembourgerMacedonianMalaysianMalteseMarshalleseMenomineeMexicanMexican American IndianMongolianMoroccanNative HawaiianNavajoNepaleseNew ZealanderNicaraguanNigerianNorthern EuropeanNorwegianOkinawanOsageOttawaPaiutePakistaniPalestinianPanamanianParaguayanPennsylvania GermanPeruvianPimaPolishPortuguesePotawatomiPuebloPuerto RicanPuget Sound SalishRomanianRussianSalvadoranSamoanScandinavianScotch-IrishScottishSeminoleSenegaleseSerbianShoshoneSierra LeoneanSiouxSlavicSlovakSloveneSomaliSouth AfricanSouth AmericanSouth American IndianSoviet UnionSpaniardSpanishSpanish AmericanSpanish American IndianSri LankanSubsaharan AfricanSudaneseSwedishSwissSyrianTaiwaneseThaiTlingit-HaidaTohono O'OdhamTonganTrinidadian and TobagonianTsimshianTurkishU.S. Virgin IslanderUgandanUkrainianUruguayanUteVenezuelanVietnameseWelshWest IndianYakamaYaquiYugoslavianYumanYup'ikZimbabwean
Immigration
NonimmigrantsImmigrantsAfghanistanAfricaAlbaniaArgentinaArmeniaAsiaAustraliaAustriaBahamasBangladeshBarbadosBelarusBelgiumBelizeBoliviaBosnia and HerzegovinaBrazilBulgariaBurma/MyanmarCabo VerdeCambodiaCameroonCanadaCaribbeanCentral AmericaChileChinaColombiaCongoCosta RicaCroatiaCubaCzechoslovakiaDenmarkDominicaDominican RepublicEastern AfricaEastern AsiaEastern EuropeEcuadorEgyptEl SalvadorEnglandEritreaEthiopiaEuropeFijiFranceGermanyGhanaGreeceGrenadaGuatemalaGuyanaHaitiHondurasHong KongHungaryIndonesiaIranIraqIrelandIsraelItalyJamaicaJapanJordanKazakhstanKenyaKoreaKuwaitLaosLatin AmericaLatviaLebanonLiberiaLithuaniaMalaysiaMexicoMicronesiaMiddle AfricaMoldovaMoroccoNepalNetherlandsNicaraguaNigeriaNorth AmericaNorth MacedoniaNorthern AfricaNorthern EuropeNorwayOceaniaPakistanPanamaPeruPhilippinesPolandPortugalRomaniaRussiaSaudi ArabiaScotlandSenegalSerbiaSierra LeoneSingaporeSomaliaSouth AfricaSouth AmericaSouth Central AsiaSouth Eastern AsiaSouthern EuropeSpainSri LankaSt. Vincent and the GrenadinesSudanSwedenSwitzerlandSyriaTaiwanThailandTrinidad and TobagoTurkeyUgandaUkraineUruguayUzbekistanVenezuelaVietnamWest IndiesWestern AfricaWestern AsiaWestern EuropeYemenZaireZimbabweAzores
Unemployment Among Youth under 25 years
Income
Poverty
Unemployment
Labor Participation
Family Structure
Vehicle Availability
Education Level
Disability

Unemployment Among Youth under 25 years Comparison

Immigrants from India

Immigrants from Spain

Exceptional
Excellent
10.7%
UNEMPLOYMENT AMONG YOUTH UNDER 25 YEARS
100.0/ 100
METRIC RATING
26th/ 347
METRIC RANK
11.4%
UNEMPLOYMENT AMONG YOUTH UNDER 25 YEARS
84.6/ 100
METRIC RATING
131st/ 347
METRIC RANK

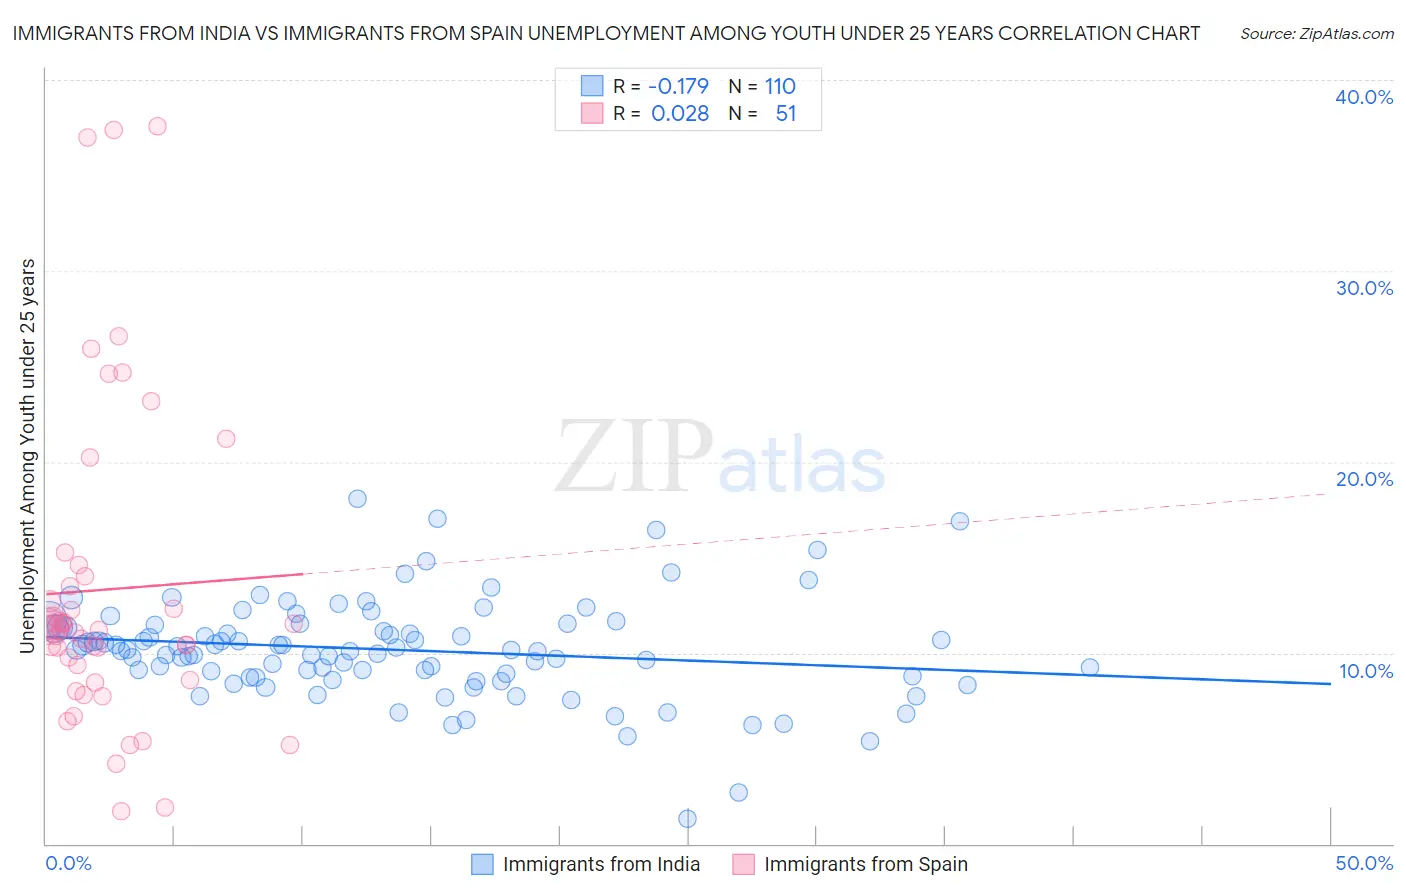
Immigrants from India vs Immigrants from Spain Unemployment Among Youth under 25 years Correlation Chart

The statistical analysis conducted on geographies consisting of 428,221,215 people shows a poor negative correlation between the proportion of Immigrants from India and unemployment rate among youth under the age of 25 in the United States with a correlation coefficient (R) of -0.179 and weighted average of 10.7%. Similarly, the statistical analysis conducted on geographies consisting of 238,223,955 people shows no correlation between the proportion of Immigrants from Spain and unemployment rate among youth under the age of 25 in the United States with a correlation coefficient (R) of 0.028 and weighted average of 11.4%, a difference of 6.9%.
Immigrants from India vs Immigrants from Spain Unemployment Among Youth under 25 years

Unemployment Among Youth under 25 years Correlation Summary

MeasurementImmigrants from IndiaImmigrants from Spain
Minimum1.3%1.7%
Maximum18.0%37.6%
Range16.7%35.9%
Mean10.2%13.3%
Median10.1%11.2%
Interquartile 25% (IQ1)8.8%8.6%
Interquartile 75% (IQ3)11.4%14.0%
Interquartile Range (IQR)2.6%5.4%
Standard Deviation (Sample)2.6%8.3%
Standard Deviation (Population)2.6%8.2%

Similar Demographics by Unemployment Among Youth under 25 years

Demographics Similar to Immigrants from India by Unemployment Among Youth under 25 years

In terms of unemployment among youth under 25 years, the demographic groups most similar to Immigrants from India are Yugoslavian (10.7%, a difference of 0.020%), Somali (10.7%, a difference of 0.060%), Finnish (10.7%, a difference of 0.10%), Immigrants from North Macedonia (10.7%, a difference of 0.10%), and Immigrants from Bosnia and Herzegovina (10.6%, a difference of 0.34%).
DemographicsRating | RankUnemployment Among Youth under 25 years
Immigrants | Burma/Myanmar
100.0
/100
|
#19
Exceptional
10.6%
Dutch
100.0
/100
|
#20
Exceptional
10.6%
Pennsylvania Germans
100.0
/100
|
#21
Exceptional
10.6%
Belgians
100.0
/100
|
#22
Exceptional
10.6%
Immigrants | Bosnia and Herzegovina
100.0
/100
|
#23
Exceptional
10.6%
Finns
100.0
/100
|
#24
Exceptional
10.7%
Immigrants | North Macedonia
100.0
/100
|
#25
Exceptional
10.7%
Immigrants | India
100.0
/100
|
#26
Exceptional
10.7%
Yugoslavians
100.0
/100
|
#27
Exceptional
10.7%
Somalis
100.0
/100
|
#28
Exceptional
10.7%
Chinese
99.9
/100
|
#29
Exceptional
10.7%
Osage
99.9
/100
|
#30
Exceptional
10.7%
Slovenes
99.9
/100
|
#31
Exceptional
10.7%
Taiwanese
99.9
/100
|
#32
Exceptional
10.8%
Europeans
99.9
/100
|
#33
Exceptional
10.8%

Demographics Similar to Immigrants from Spain by Unemployment Among Youth under 25 years

In terms of unemployment among youth under 25 years, the demographic groups most similar to Immigrants from Spain are Hungarian (11.4%, a difference of 0.090%), Turkish (11.4%, a difference of 0.10%), Ethiopian (11.4%, a difference of 0.11%), Immigrants from Hungary (11.4%, a difference of 0.12%), and Lebanese (11.4%, a difference of 0.12%).
DemographicsRating | RankUnemployment Among Youth under 25 years
Italians
87.2
/100
|
#124
Excellent
11.4%
Immigrants | Argentina
87.2
/100
|
#125
Excellent
11.4%
Canadians
86.6
/100
|
#126
Excellent
11.4%
Greeks
86.2
/100
|
#127
Excellent
11.4%
Immigrants | Hungary
86.0
/100
|
#128
Excellent
11.4%
Turks
85.8
/100
|
#129
Excellent
11.4%
Hungarians
85.7
/100
|
#130
Excellent
11.4%
Immigrants | Spain
84.6
/100
|
#131
Excellent
11.4%
Ethiopians
83.2
/100
|
#132
Excellent
11.4%
Lebanese
83.1
/100
|
#133
Excellent
11.4%
Immigrants | Chile
80.4
/100
|
#134
Excellent
11.4%
Immigrants | Oceania
80.2
/100
|
#135
Excellent
11.4%
Romanians
80.1
/100
|
#136
Excellent
11.4%
Asians
79.7
/100
|
#137
Good
11.4%
Immigrants | England
78.1
/100
|
#138
Good
11.5%