Immigrants from India vs Immigrants from Netherlands Unemployment Among Seniors over 75 years

COMPARE

Immigrants from India
Race
Ancestry
AfghanAfricanAlaska NativeAlaskan AthabascanAlbanianAleutAlsatianAmericanApacheArabArapahoArgentineanArmenianAssyrian/Chaldean/SyriacAustralianAustrianBahamianBangladeshiBarbadianBasqueBelgianBelizeanBermudanBhutaneseBlackfeetBolivianBrazilianBritishBritish West IndianBulgarianBurmeseCajunCambodianCanadianCape VerdeanCarpatho RusynCelticCentral AmericanCentral American IndianCherokeeCheyenneChickasawChileanChineseChippewaChoctawColombianColvilleComancheCosta RicanCreeCreekCroatianCrowCubanCypriotCzechCzechoslovakianDanishDelawareDominicanDutchDutch West IndianEastern EuropeanEcuadorianEgyptianEnglishEstonianEthiopianEuropeanFijianFilipinoFinnishFrenchFrench American IndianFrench CanadianGermanGerman RussianGhanaianGreekGuamanian/ChamorroGuatemalanGuyaneseHaitianHmongHonduranHopiHoumaHungarianIcelanderIndian (Asian)IndonesianInupiatIranianIraqiIrishIroquoisIsraeliItalianJamaicanJapaneseJordanianKenyanKiowaKoreanLaotianLatvianLebaneseLiberianLithuanianLumbeeLuxembourgerMacedonianMalaysianMalteseMarshalleseMexicanMexican American IndianMongolianMoroccanNative HawaiianNavajoNepaleseNew ZealanderNicaraguanNigerianNorthern EuropeanNorwegianOkinawanOsageOttawaPaiutePakistaniPalestinianPanamanianParaguayanPennsylvania GermanPeruvianPimaPolishPortuguesePotawatomiPuebloPuerto RicanPuget Sound SalishRomanianRussianSalvadoranSamoanScandinavianScotch-IrishScottishSeminoleSenegaleseSerbianShoshoneSierra LeoneanSiouxSlavicSlovakSloveneSomaliSouth AfricanSouth AmericanSouth American IndianSoviet UnionSpaniardSpanishSpanish AmericanSpanish American IndianSri LankanSubsaharan AfricanSudaneseSwedishSwissSyrianTaiwaneseThaiTlingit-HaidaTohono O'OdhamTonganTrinidadian and TobagonianTsimshianTurkishU.S. Virgin IslanderUgandanUkrainianUruguayanUteVenezuelanVietnameseWelshWest IndianYakamaYaquiYugoslavianYumanYup'ikZimbabwean
Immigration
NonimmigrantsImmigrantsAfghanistanAfricaAlbaniaArgentinaArmeniaAsiaAustraliaAustriaBahamasBangladeshBarbadosBelarusBelgiumBelizeBoliviaBosnia and HerzegovinaBrazilBulgariaBurma/MyanmarCabo VerdeCambodiaCameroonCanadaCaribbeanCentral AmericaChileChinaColombiaCongoCosta RicaCroatiaCubaCzechoslovakiaDenmarkDominicaDominican RepublicEastern AfricaEastern AsiaEastern EuropeEcuadorEgyptEl SalvadorEnglandEritreaEthiopiaEuropeFijiFranceGermanyGhanaGreeceGrenadaGuatemalaGuyanaHaitiHondurasHong KongHungaryIndiaIndonesiaIranIraqIrelandIsraelItalyJamaicaJapanJordanKazakhstanKenyaKoreaKuwaitLaosLatin AmericaLatviaLebanonLiberiaLithuaniaMalaysiaMexicoMicronesiaMiddle AfricaMoldovaMoroccoNepalNicaraguaNigeriaNorth AmericaNorth MacedoniaNorthern AfricaNorthern EuropeNorwayOceaniaPakistanPanamaPeruPhilippinesPolandPortugalRomaniaRussiaSaudi ArabiaScotlandSenegalSerbiaSierra LeoneSingaporeSomaliaSouth AfricaSouth AmericaSouth Central AsiaSouth Eastern AsiaSouthern EuropeSpainSri LankaSt. Vincent and the GrenadinesSudanSwedenSwitzerlandSyriaTaiwanThailandTrinidad and TobagoTurkeyUgandaUkraineUruguayUzbekistanVenezuelaVietnamWest IndiesWestern AfricaWestern AsiaWestern EuropeYemenZaireZimbabweAzores
Immigrants from Netherlands
Race
Ancestry
AfghanAfricanAlaska NativeAlaskan AthabascanAlbanianAleutAlsatianAmericanApacheArabArapahoArgentineanArmenianAssyrian/Chaldean/SyriacAustralianAustrianBahamianBangladeshiBarbadianBasqueBelgianBelizeanBermudanBhutaneseBlackfeetBolivianBrazilianBritishBritish West IndianBulgarianBurmeseCajunCambodianCanadianCape VerdeanCarpatho RusynCelticCentral AmericanCentral American IndianCherokeeCheyenneChickasawChileanChineseChippewaChoctawColombianColvilleComancheCosta RicanCreeCreekCroatianCrowCubanCypriotCzechCzechoslovakianDanishDelawareDominicanDutchDutch West IndianEastern EuropeanEcuadorianEgyptianEnglishEstonianEthiopianEuropeanFijianFilipinoFinnishFrenchFrench American IndianFrench CanadianGermanGerman RussianGhanaianGreekGuamanian/ChamorroGuatemalanGuyaneseHaitianHmongHonduranHopiHoumaHungarianIcelanderIndian (Asian)IndonesianInupiatIranianIraqiIrishIroquoisIsraeliItalianJamaicanJapaneseJordanianKenyanKiowaKoreanLaotianLatvianLebaneseLiberianLithuanianLumbeeLuxembourgerMacedonianMalaysianMalteseMarshalleseMexicanMexican American IndianMongolianMoroccanNative HawaiianNavajoNepaleseNew ZealanderNicaraguanNigerianNorthern EuropeanNorwegianOkinawanOsageOttawaPaiutePakistaniPalestinianPanamanianParaguayanPennsylvania GermanPeruvianPimaPolishPortuguesePotawatomiPuebloPuerto RicanPuget Sound SalishRomanianRussianSalvadoranSamoanScandinavianScotch-IrishScottishSeminoleSenegaleseSerbianShoshoneSierra LeoneanSiouxSlavicSlovakSloveneSomaliSouth AfricanSouth AmericanSouth American IndianSoviet UnionSpaniardSpanishSpanish AmericanSpanish American IndianSri LankanSubsaharan AfricanSudaneseSwedishSwissSyrianTaiwaneseThaiTlingit-HaidaTohono O'OdhamTonganTrinidadian and TobagonianTsimshianTurkishU.S. Virgin IslanderUgandanUkrainianUruguayanUteVenezuelanVietnameseWelshWest IndianYakamaYaquiYugoslavianYumanYup'ikZimbabwean
Immigration
NonimmigrantsImmigrantsAfghanistanAfricaAlbaniaArgentinaArmeniaAsiaAustraliaAustriaBahamasBangladeshBarbadosBelarusBelgiumBelizeBoliviaBosnia and HerzegovinaBrazilBulgariaBurma/MyanmarCabo VerdeCambodiaCameroonCanadaCaribbeanCentral AmericaChileChinaColombiaCongoCosta RicaCroatiaCubaCzechoslovakiaDenmarkDominicaDominican RepublicEastern AfricaEastern AsiaEastern EuropeEcuadorEgyptEl SalvadorEnglandEritreaEthiopiaEuropeFijiFranceGermanyGhanaGreeceGrenadaGuatemalaGuyanaHaitiHondurasHong KongHungaryIndonesiaIranIraqIrelandIsraelItalyJamaicaJapanJordanKazakhstanKenyaKoreaKuwaitLaosLatin AmericaLatviaLebanonLiberiaLithuaniaMalaysiaMexicoMicronesiaMiddle AfricaMoldovaMoroccoNepalNetherlandsNicaraguaNigeriaNorth AmericaNorth MacedoniaNorthern AfricaNorthern EuropeNorwayOceaniaPakistanPanamaPeruPhilippinesPolandPortugalRomaniaRussiaSaudi ArabiaScotlandSenegalSerbiaSierra LeoneSingaporeSomaliaSouth AfricaSouth AmericaSouth Central AsiaSouth Eastern AsiaSouthern EuropeSpainSri LankaSt. Vincent and the GrenadinesSudanSwedenSwitzerlandSyriaTaiwanThailandTrinidad and TobagoTurkeyUgandaUkraineUruguayUzbekistanVenezuelaVietnamWest IndiesWestern AfricaWestern AsiaWestern EuropeYemenZaireZimbabweAzores
Unemployment Among Seniors over 75 years
Income
Poverty
Unemployment
Labor Participation
Family Structure
Vehicle Availability
Education Level
Disability

Unemployment Among Seniors over 75 years Comparison

Immigrants from India

Immigrants from Netherlands

Exceptional
Exceptional
8.2%
UNEMPLOYMENT AMONG SENIORS OVER 75 YEARS
98.6/ 100
METRIC RATING
112th/ 347
METRIC RANK
8.1%
UNEMPLOYMENT AMONG SENIORS OVER 75 YEARS
99.5/ 100
METRIC RATING
93rd/ 347
METRIC RANK

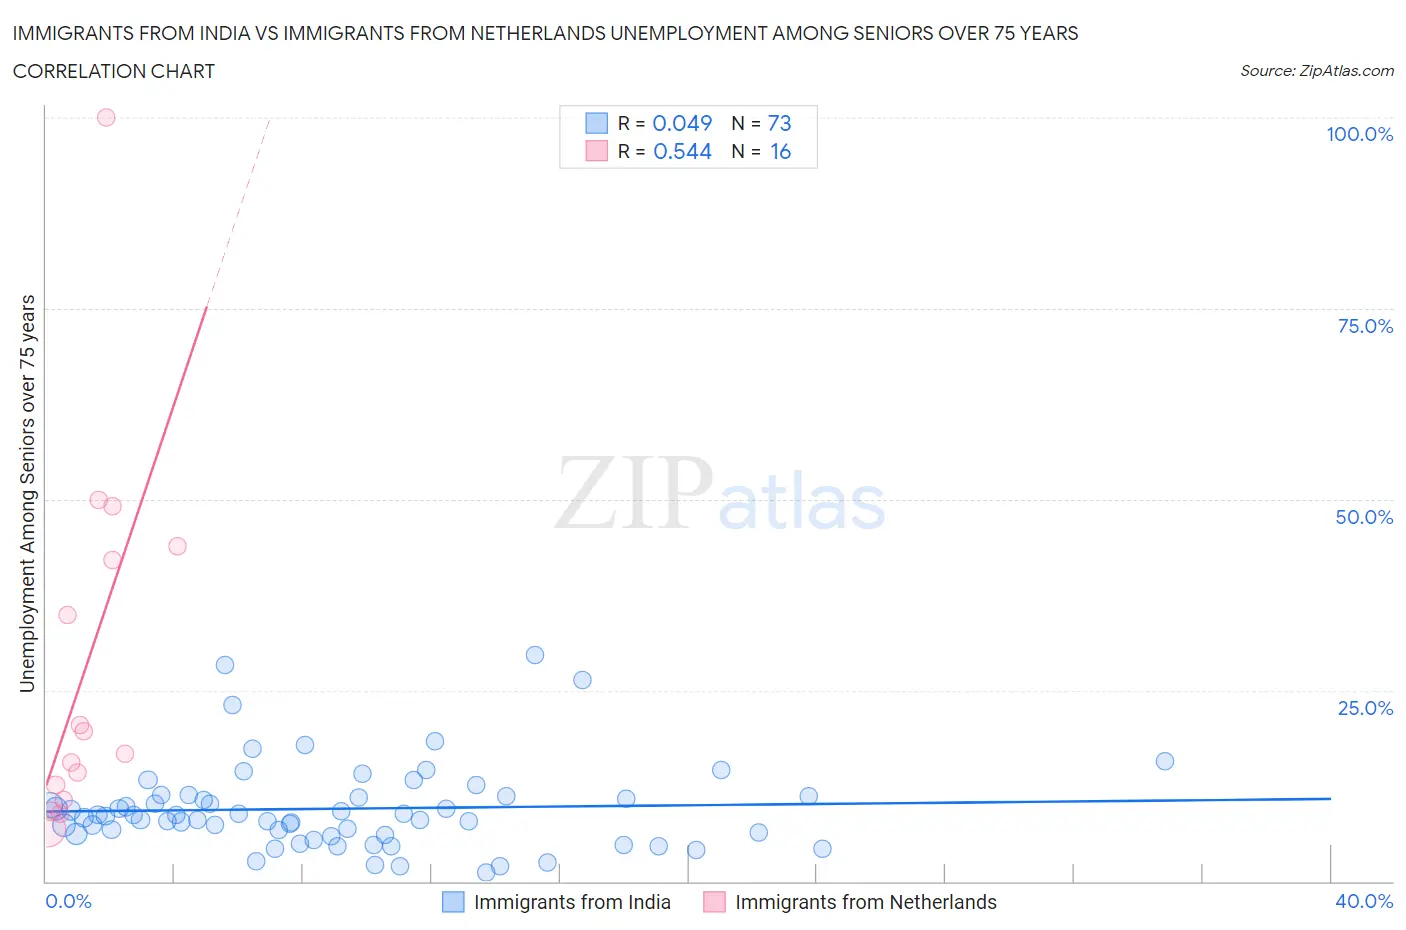
Immigrants from India vs Immigrants from Netherlands Unemployment Among Seniors over 75 years Correlation Chart

The statistical analysis conducted on geographies consisting of 212,990,151 people shows no correlation between the proportion of Immigrants from India and unemployment rate among seniors over the age of 75 in the United States with a correlation coefficient (R) of 0.049 and weighted average of 8.2%. Similarly, the statistical analysis conducted on geographies consisting of 147,093,510 people shows a substantial positive correlation between the proportion of Immigrants from Netherlands and unemployment rate among seniors over the age of 75 in the United States with a correlation coefficient (R) of 0.544 and weighted average of 8.1%, a difference of 1.4%.
Immigrants from India vs Immigrants from Netherlands Unemployment Among Seniors over 75 years

Unemployment Among Seniors over 75 years Correlation Summary

MeasurementImmigrants from IndiaImmigrants from Netherlands
Minimum1.1%6.8%
Maximum29.7%100.0%
Range28.6%93.2%
Mean9.5%28.4%
Median8.5%18.2%
Interquartile 25% (IQ1)6.1%11.7%
Interquartile 75% (IQ3)11.2%43.0%
Interquartile Range (IQR)5.1%31.3%
Standard Deviation (Sample)5.7%24.4%
Standard Deviation (Population)5.6%23.6%

Demographics Similar to Immigrants from India and Immigrants from Netherlands by Unemployment Among Seniors over 75 years

In terms of unemployment among seniors over 75 years, the demographic groups most similar to Immigrants from India are French American Indian (8.2%, a difference of 0.13%), Marshallese (8.2%, a difference of 0.17%), Immigrants from Lebanon (8.2%, a difference of 0.20%), Laotian (8.2%, a difference of 0.22%), and Sri Lankan (8.2%, a difference of 0.36%). Similarly, the demographic groups most similar to Immigrants from Netherlands are Immigrants from Ireland (8.1%, a difference of 0.030%), Venezuelan (8.1%, a difference of 0.080%), Nicaraguan (8.2%, a difference of 0.28%), Immigrants from Belgium (8.2%, a difference of 0.29%), and Immigrants from Sri Lanka (8.2%, a difference of 0.37%).
DemographicsRating | RankUnemployment Among Seniors over 75 years
Venezuelans
99.5
/100
|
#92
Exceptional
8.1%
Immigrants | Netherlands
99.5
/100
|
#93
Exceptional
8.1%
Immigrants | Ireland
99.4
/100
|
#94
Exceptional
8.1%
Nicaraguans
99.3
/100
|
#95
Exceptional
8.2%
Immigrants | Belgium
99.3
/100
|
#96
Exceptional
8.2%
Immigrants | Sri Lanka
99.3
/100
|
#97
Exceptional
8.2%
Immigrants | Northern Africa
99.3
/100
|
#98
Exceptional
8.2%
Burmese
99.2
/100
|
#99
Exceptional
8.2%
Immigrants | Kazakhstan
99.2
/100
|
#100
Exceptional
8.2%
Immigrants | Serbia
99.2
/100
|
#101
Exceptional
8.2%
Immigrants | Panama
99.1
/100
|
#102
Exceptional
8.2%
South American Indians
99.1
/100
|
#103
Exceptional
8.2%
Immigrants | South Central Asia
99.0
/100
|
#104
Exceptional
8.2%
Immigrants | Caribbean
99.0
/100
|
#105
Exceptional
8.2%
Immigrants | Honduras
99.0
/100
|
#106
Exceptional
8.2%
Sri Lankans
98.9
/100
|
#107
Exceptional
8.2%
Laotians
98.8
/100
|
#108
Exceptional
8.2%
Immigrants | Lebanon
98.8
/100
|
#109
Exceptional
8.2%
Marshallese
98.7
/100
|
#110
Exceptional
8.2%
French American Indians
98.7
/100
|
#111
Exceptional
8.2%
Immigrants | India
98.6
/100
|
#112
Exceptional
8.2%