Immigrants from Hungary vs Osage Unemployment Among Ages 25 to 29 years

COMPARE

Immigrants from Hungary
Race
Ancestry
AfghanAfricanAlaska NativeAlaskan AthabascanAlbanianAleutAlsatianAmericanApacheArabArapahoArgentineanArmenianAssyrian/Chaldean/SyriacAustralianAustrianBahamianBangladeshiBarbadianBasqueBelgianBelizeanBermudanBhutaneseBlackfeetBolivianBrazilianBritishBritish West IndianBulgarianBurmeseCajunCambodianCanadianCape VerdeanCarpatho RusynCelticCentral AmericanCentral American IndianCherokeeCheyenneChickasawChileanChineseChippewaChoctawColombianColvilleComancheCosta RicanCreeCreekCroatianCrowCubanCypriotCzechCzechoslovakianDanishDelawareDominicanDutchDutch West IndianEastern EuropeanEcuadorianEgyptianEnglishEstonianEthiopianEuropeanFijianFilipinoFinnishFrenchFrench American IndianFrench CanadianGermanGerman RussianGhanaianGreekGuamanian/ChamorroGuatemalanGuyaneseHaitianHmongHonduranHopiHoumaHungarianIcelanderIndian (Asian)IndonesianInupiatIranianIraqiIrishIroquoisIsraeliItalianJamaicanJapaneseJordanianKenyanKiowaKoreanLaotianLatvianLebaneseLiberianLithuanianLumbeeLuxembourgerMacedonianMalaysianMalteseMarshalleseMenomineeMexicanMexican American IndianMongolianMoroccanNative HawaiianNavajoNepaleseNew ZealanderNicaraguanNigerianNorthern EuropeanNorwegianOkinawanOttawaPaiutePakistaniPalestinianPanamanianParaguayanPennsylvania GermanPeruvianPimaPolishPortuguesePotawatomiPuebloPuerto RicanPuget Sound SalishRomanianRussianSalvadoranSamoanScandinavianScotch-IrishScottishSeminoleSenegaleseSerbianShoshoneSierra LeoneanSiouxSlavicSlovakSloveneSomaliSouth AfricanSouth AmericanSouth American IndianSoviet UnionSpaniardSpanishSpanish AmericanSpanish American IndianSri LankanSubsaharan AfricanSudaneseSwedishSwissSyrianTaiwaneseThaiTlingit-HaidaTohono O'OdhamTonganTrinidadian and TobagonianTsimshianTurkishU.S. Virgin IslanderUgandanUkrainianUruguayanUteVenezuelanVietnameseWelshWest IndianYakamaYaquiYugoslavianYumanYup'ikZimbabwean
Immigration
NonimmigrantsImmigrantsAfghanistanAfricaAlbaniaArgentinaArmeniaAsiaAustraliaAustriaBahamasBangladeshBarbadosBelarusBelgiumBelizeBoliviaBosnia and HerzegovinaBrazilBulgariaBurma/MyanmarCabo VerdeCambodiaCameroonCanadaCaribbeanCentral AmericaChileChinaColombiaCongoCosta RicaCroatiaCubaCzechoslovakiaDenmarkDominicaDominican RepublicEastern AfricaEastern AsiaEastern EuropeEcuadorEgyptEl SalvadorEnglandEritreaEthiopiaEuropeFijiFranceGermanyGhanaGreeceGrenadaGuatemalaGuyanaHaitiHondurasHong KongHungaryIndiaIndonesiaIranIraqIrelandIsraelItalyJamaicaJapanJordanKazakhstanKenyaKoreaKuwaitLaosLatin AmericaLatviaLebanonLiberiaLithuaniaMalaysiaMexicoMicronesiaMiddle AfricaMoldovaMoroccoNepalNetherlandsNicaraguaNigeriaNorth AmericaNorth MacedoniaNorthern AfricaNorthern EuropeNorwayOceaniaPakistanPanamaPeruPhilippinesPolandPortugalRomaniaRussiaSaudi ArabiaScotlandSenegalSerbiaSierra LeoneSingaporeSomaliaSouth AfricaSouth AmericaSouth Central AsiaSouth Eastern AsiaSouthern EuropeSpainSri LankaSt. Vincent and the GrenadinesSudanSwedenSwitzerlandSyriaTaiwanThailandTrinidad and TobagoTurkeyUgandaUkraineUruguayUzbekistanVenezuelaVietnamWest IndiesWestern AfricaWestern AsiaWestern EuropeYemenZaireZimbabweAzores
Osage
Race
Ancestry
AfghanAfricanAlaska NativeAlaskan AthabascanAlbanianAleutAlsatianAmericanApacheArabArapahoArgentineanArmenianAssyrian/Chaldean/SyriacAustralianAustrianBahamianBangladeshiBarbadianBasqueBelgianBelizeanBermudanBhutaneseBlackfeetBolivianBrazilianBritishBritish West IndianBulgarianBurmeseCajunCambodianCanadianCape VerdeanCarpatho RusynCelticCentral AmericanCentral American IndianCherokeeCheyenneChickasawChileanChineseChippewaChoctawColombianColvilleComancheCosta RicanCreeCreekCroatianCrowCubanCypriotCzechCzechoslovakianDanishDelawareDominicanDutchDutch West IndianEastern EuropeanEcuadorianEgyptianEnglishEstonianEthiopianEuropeanFijianFilipinoFinnishFrenchFrench American IndianFrench CanadianGermanGerman RussianGhanaianGreekGuamanian/ChamorroGuatemalanGuyaneseHaitianHmongHonduranHopiHoumaHungarianIcelanderIndian (Asian)IndonesianInupiatIranianIraqiIrishIroquoisIsraeliItalianJamaicanJapaneseJordanianKenyanKiowaKoreanLaotianLatvianLebaneseLiberianLithuanianLumbeeLuxembourgerMacedonianMalaysianMalteseMarshalleseMenomineeMexicanMexican American IndianMongolianMoroccanNative HawaiianNavajoNepaleseNew ZealanderNicaraguanNigerianNorthern EuropeanNorwegianOkinawanOsageOttawaPaiutePakistaniPalestinianPanamanianParaguayanPennsylvania GermanPeruvianPimaPolishPortuguesePotawatomiPuebloPuerto RicanPuget Sound SalishRomanianRussianSalvadoranSamoanScandinavianScotch-IrishScottishSeminoleSenegaleseSerbianShoshoneSierra LeoneanSiouxSlavicSlovakSloveneSomaliSouth AfricanSouth AmericanSouth American IndianSoviet UnionSpaniardSpanishSpanish AmericanSpanish American IndianSri LankanSubsaharan AfricanSudaneseSwedishSwissSyrianTaiwaneseThaiTlingit-HaidaTohono O'OdhamTonganTrinidadian and TobagonianTsimshianTurkishU.S. Virgin IslanderUgandanUkrainianUruguayanUteVenezuelanVietnameseWelshWest IndianYakamaYaquiYugoslavianYumanYup'ikZimbabwean
Immigration
NonimmigrantsImmigrantsAfghanistanAfricaAlbaniaArgentinaArmeniaAsiaAustraliaAustriaBahamasBangladeshBarbadosBelarusBelgiumBelizeBoliviaBosnia and HerzegovinaBrazilBulgariaBurma/MyanmarCabo VerdeCambodiaCameroonCanadaCaribbeanCentral AmericaChileChinaColombiaCongoCosta RicaCroatiaCubaCzechoslovakiaDenmarkDominicaDominican RepublicEastern AfricaEastern AsiaEastern EuropeEcuadorEgyptEl SalvadorEnglandEritreaEthiopiaEuropeFijiFranceGermanyGhanaGreeceGrenadaGuatemalaGuyanaHaitiHondurasHong KongIndiaIndonesiaIranIraqIrelandIsraelItalyJamaicaJapanJordanKazakhstanKenyaKoreaKuwaitLaosLatin AmericaLatviaLebanonLiberiaLithuaniaMalaysiaMexicoMicronesiaMiddle AfricaMoldovaMoroccoNepalNetherlandsNicaraguaNigeriaNorth AmericaNorth MacedoniaNorthern AfricaNorthern EuropeNorwayOceaniaPakistanPanamaPeruPhilippinesPolandPortugalRomaniaRussiaSaudi ArabiaScotlandSenegalSerbiaSierra LeoneSingaporeSomaliaSouth AfricaSouth AmericaSouth Central AsiaSouth Eastern AsiaSouthern EuropeSpainSri LankaSt. Vincent and the GrenadinesSudanSwedenSwitzerlandSyriaTaiwanThailandTrinidad and TobagoTurkeyUgandaUkraineUruguayUzbekistanVenezuelaVietnamWest IndiesWestern AfricaWestern AsiaWestern EuropeYemenZaireZimbabweAzores
Unemployment Among Ages 25 to 29 years
Income
Poverty
Unemployment
Labor Participation
Family Structure
Vehicle Availability
Education Level
Disability

Unemployment Among Ages 25 to 29 years Comparison

Immigrants from Hungary

Osage

Excellent
Average
6.4%
UNEMPLOYMENT AMONG AGES 25 TO 29 YEARS
89.4/ 100
METRIC RATING
106th/ 347
METRIC RANK
6.7%
UNEMPLOYMENT AMONG AGES 25 TO 29 YEARS
48.1/ 100
METRIC RATING
176th/ 347
METRIC RANK

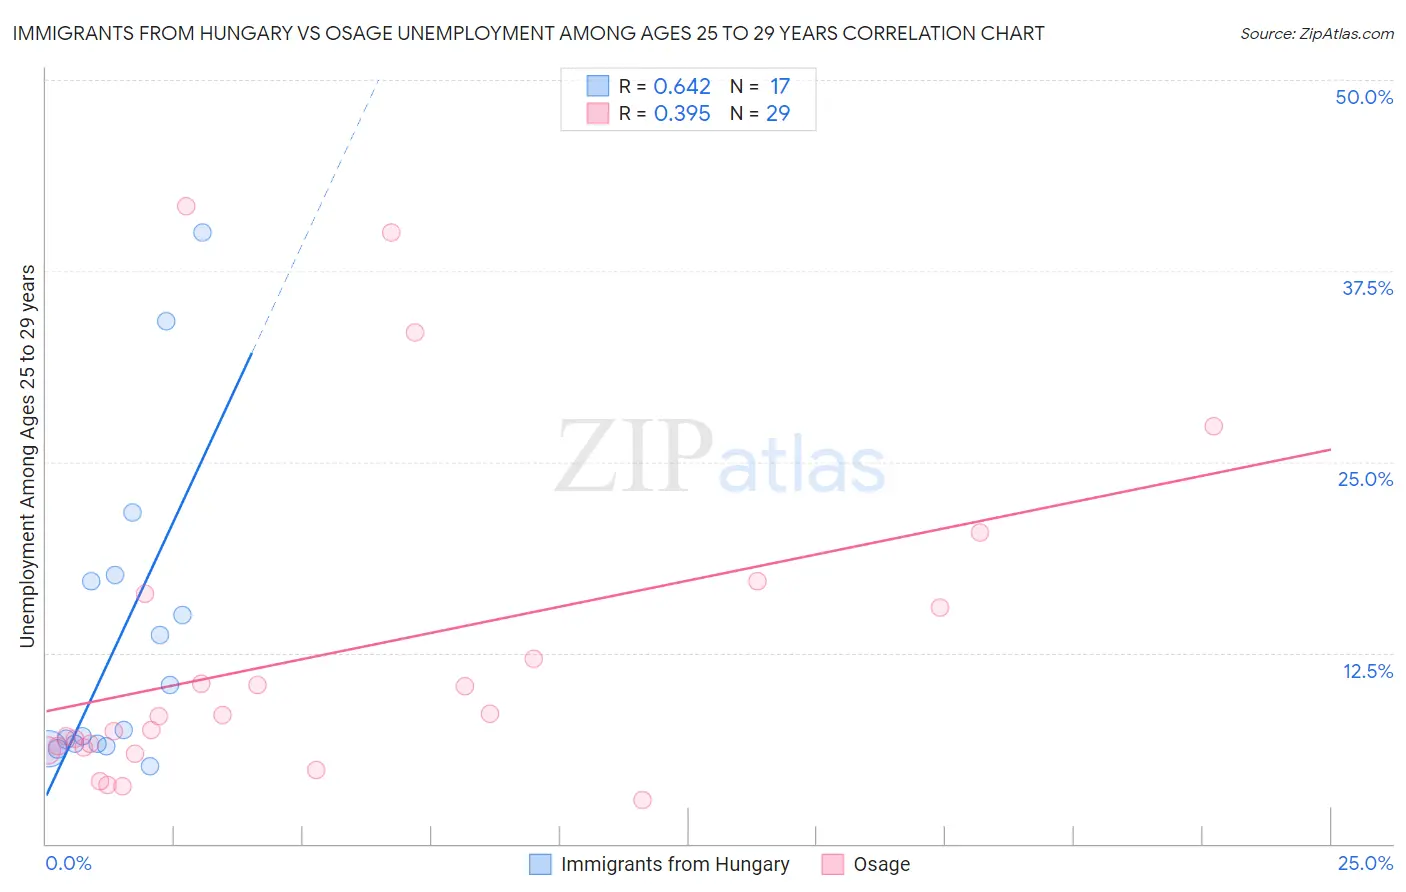
Immigrants from Hungary vs Osage Unemployment Among Ages 25 to 29 years Correlation Chart

The statistical analysis conducted on geographies consisting of 189,998,532 people shows a significant positive correlation between the proportion of Immigrants from Hungary and unemployment rate among population between the ages 25 and 29 in the United States with a correlation coefficient (R) of 0.642 and weighted average of 6.4%. Similarly, the statistical analysis conducted on geographies consisting of 90,314,239 people shows a mild positive correlation between the proportion of Osage and unemployment rate among population between the ages 25 and 29 in the United States with a correlation coefficient (R) of 0.395 and weighted average of 6.7%, a difference of 3.5%.
Immigrants from Hungary vs Osage Unemployment Among Ages 25 to 29 years

Unemployment Among Ages 25 to 29 years Correlation Summary

MeasurementImmigrants from HungaryOsage
Minimum5.1%2.9%
Maximum40.0%41.7%
Range34.9%38.8%
Mean13.4%12.4%
Median7.5%8.4%
Interquartile 25% (IQ1)6.5%6.2%
Interquartile 75% (IQ3)17.4%16.0%
Interquartile Range (IQR)10.9%9.8%
Standard Deviation (Sample)10.3%10.6%
Standard Deviation (Population)10.0%10.4%

Similar Demographics by Unemployment Among Ages 25 to 29 years

Demographics Similar to Immigrants from Hungary by Unemployment Among Ages 25 to 29 years

In terms of unemployment among ages 25 to 29 years, the demographic groups most similar to Immigrants from Hungary are Immigrants from Kazakhstan (6.4%, a difference of 0.070%), Cypriot (6.4%, a difference of 0.11%), Swiss (6.4%, a difference of 0.14%), Immigrants from Congo (6.4%, a difference of 0.17%), and British (6.4%, a difference of 0.19%).
DemographicsRating | RankUnemployment Among Ages 25 to 29 years
Iraqis
91.3
/100
|
#99
Exceptional
6.4%
Uruguayans
91.2
/100
|
#100
Exceptional
6.4%
Immigrants | Ireland
91.1
/100
|
#101
Exceptional
6.4%
British
90.5
/100
|
#102
Exceptional
6.4%
Immigrants | Congo
90.4
/100
|
#103
Exceptional
6.4%
Cypriots
90.1
/100
|
#104
Exceptional
6.4%
Immigrants | Kazakhstan
89.8
/100
|
#105
Excellent
6.4%
Immigrants | Hungary
89.4
/100
|
#106
Excellent
6.4%
Swiss
88.6
/100
|
#107
Excellent
6.4%
Croatians
88.2
/100
|
#108
Excellent
6.4%
Immigrants | Albania
87.9
/100
|
#109
Excellent
6.4%
Europeans
87.8
/100
|
#110
Excellent
6.4%
Immigrants | Colombia
87.6
/100
|
#111
Excellent
6.4%
Immigrants | Nicaragua
87.5
/100
|
#112
Excellent
6.4%
Immigrants | Egypt
87.1
/100
|
#113
Excellent
6.5%

Demographics Similar to Osage by Unemployment Among Ages 25 to 29 years

In terms of unemployment among ages 25 to 29 years, the demographic groups most similar to Osage are Immigrants from Israel (6.7%, a difference of 0.020%), Immigrants from South Eastern Asia (6.7%, a difference of 0.060%), Immigrants from North America (6.6%, a difference of 0.12%), Immigrants from Iraq (6.7%, a difference of 0.18%), and Costa Rican (6.7%, a difference of 0.19%).
DemographicsRating | RankUnemployment Among Ages 25 to 29 years
South Americans
54.5
/100
|
#169
Average
6.6%
Albanians
53.5
/100
|
#170
Average
6.6%
Immigrants | Cambodia
52.6
/100
|
#171
Average
6.6%
Bangladeshis
51.6
/100
|
#172
Average
6.6%
Russians
51.3
/100
|
#173
Average
6.6%
Immigrants | North America
50.0
/100
|
#174
Average
6.6%
Immigrants | South Eastern Asia
49.1
/100
|
#175
Average
6.7%
Osage
48.1
/100
|
#176
Average
6.7%
Immigrants | Israel
47.8
/100
|
#177
Average
6.7%
Immigrants | Iraq
45.1
/100
|
#178
Average
6.7%
Costa Ricans
44.9
/100
|
#179
Average
6.7%
Immigrants | Africa
41.1
/100
|
#180
Average
6.7%
Immigrants | Western Europe
41.1
/100
|
#181
Average
6.7%
Czechoslovakians
40.7
/100
|
#182
Average
6.7%
Immigrants | Scotland
39.6
/100
|
#183
Fair
6.7%