Immigrants from Honduras vs Immigrants from Western Africa Unemployment Among Ages 20 to 24 years
COMPARE
Immigrants from Honduras
Immigrants from Western Africa
Unemployment Among Ages 20 to 24 years
Unemployment Among Ages 20 to 24 years Comparison
Immigrants from Honduras
Immigrants from Western Africa
10.4%
UNEMPLOYMENT AMONG AGES 20 TO 24 YEARS
17.9/ 100
METRIC RATING
207th/ 347
METRIC RANK
11.7%
UNEMPLOYMENT AMONG AGES 20 TO 24 YEARS
0.0/ 100
METRIC RATING
284th/ 347
METRIC RANK
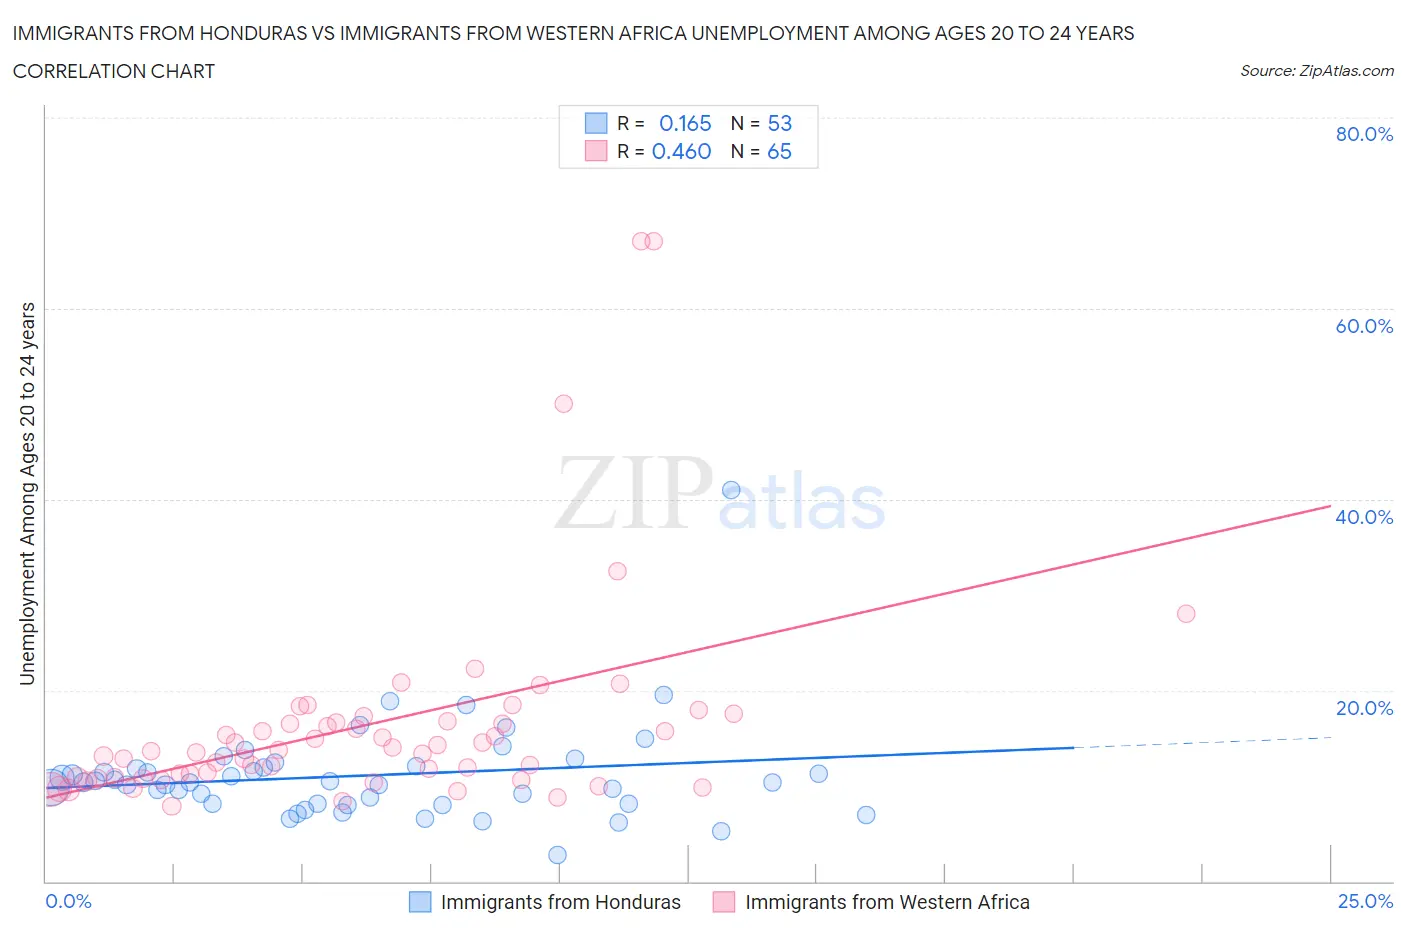
Immigrants from Honduras vs Immigrants from Western Africa Unemployment Among Ages 20 to 24 years Correlation Chart
The statistical analysis conducted on geographies consisting of 315,922,294 people shows a poor positive correlation between the proportion of Immigrants from Honduras and unemployment rate among population between the ages 20 and 24 in the United States with a correlation coefficient (R) of 0.165 and weighted average of 10.4%. Similarly, the statistical analysis conducted on geographies consisting of 350,498,787 people shows a moderate positive correlation between the proportion of Immigrants from Western Africa and unemployment rate among population between the ages 20 and 24 in the United States with a correlation coefficient (R) of 0.460 and weighted average of 11.7%, a difference of 12.3%.
Unemployment Among Ages 20 to 24 years Correlation Summary
| Measurement | Immigrants from Honduras | Immigrants from Western Africa |
| Minimum | 2.7% | 7.9% |
| Maximum | 41.0% | 67.1% |
| Range | 38.3% | 59.2% |
| Mean | 11.1% | 16.3% |
| Median | 10.3% | 13.6% |
| Interquartile 25% (IQ1) | 8.1% | 10.8% |
| Interquartile 75% (IQ3) | 12.0% | 16.7% |
| Interquartile Range (IQR) | 3.9% | 5.9% |
| Standard Deviation (Sample) | 5.4% | 11.1% |
| Standard Deviation (Population) | 5.3% | 11.0% |
Similar Demographics by Unemployment Among Ages 20 to 24 years
Demographics Similar to Immigrants from Honduras by Unemployment Among Ages 20 to 24 years
In terms of unemployment among ages 20 to 24 years, the demographic groups most similar to Immigrants from Honduras are Immigrants from Hong Kong (10.5%, a difference of 0.020%), Immigrants from Europe (10.4%, a difference of 0.030%), Peruvian (10.5%, a difference of 0.050%), Cypriot (10.4%, a difference of 0.060%), and Immigrants from Belgium (10.5%, a difference of 0.060%).
| Demographics | Rating | Rank | Unemployment Among Ages 20 to 24 years |
| Russians | 21.2 /100 | #200 | Fair 10.4% |
| Immigrants | Peru | 21.2 /100 | #201 | Fair 10.4% |
| Immigrants | Middle Africa | 20.9 /100 | #202 | Fair 10.4% |
| South Americans | 20.6 /100 | #203 | Fair 10.4% |
| Immigrants | Northern Europe | 19.5 /100 | #204 | Poor 10.4% |
| Cypriots | 18.9 /100 | #205 | Poor 10.4% |
| Immigrants | Europe | 18.5 /100 | #206 | Poor 10.4% |
| Immigrants | Honduras | 17.9 /100 | #207 | Poor 10.4% |
| Immigrants | Hong Kong | 17.6 /100 | #208 | Poor 10.5% |
| Peruvians | 17.2 /100 | #209 | Poor 10.5% |
| Immigrants | Belgium | 16.9 /100 | #210 | Poor 10.5% |
| Immigrants | Guatemala | 14.6 /100 | #211 | Poor 10.5% |
| Immigrants | Sri Lanka | 14.0 /100 | #212 | Poor 10.5% |
| Guatemalans | 12.2 /100 | #213 | Poor 10.5% |
| Kiowa | 11.7 /100 | #214 | Poor 10.5% |
Demographics Similar to Immigrants from Western Africa by Unemployment Among Ages 20 to 24 years
In terms of unemployment among ages 20 to 24 years, the demographic groups most similar to Immigrants from Western Africa are Ghanaian (11.7%, a difference of 0.010%), Soviet Union (11.7%, a difference of 0.040%), Ecuadorian (11.8%, a difference of 0.16%), Immigrants from Ecuador (11.8%, a difference of 0.25%), and U.S. Virgin Islander (11.8%, a difference of 0.30%).
| Demographics | Rating | Rank | Unemployment Among Ages 20 to 24 years |
| Africans | 0.0 /100 | #277 | Tragic 11.5% |
| Colville | 0.0 /100 | #278 | Tragic 11.6% |
| Bahamians | 0.0 /100 | #279 | Tragic 11.6% |
| Alaskan Athabascans | 0.0 /100 | #280 | Tragic 11.6% |
| Armenians | 0.0 /100 | #281 | Tragic 11.7% |
| Immigrants | Cameroon | 0.0 /100 | #282 | Tragic 11.7% |
| Ghanaians | 0.0 /100 | #283 | Tragic 11.7% |
| Immigrants | Western Africa | 0.0 /100 | #284 | Tragic 11.7% |
| Soviet Union | 0.0 /100 | #285 | Tragic 11.7% |
| Ecuadorians | 0.0 /100 | #286 | Tragic 11.8% |
| Immigrants | Ecuador | 0.0 /100 | #287 | Tragic 11.8% |
| U.S. Virgin Islanders | 0.0 /100 | #288 | Tragic 11.8% |
| Belizeans | 0.0 /100 | #289 | Tragic 11.8% |
| Immigrants | Caribbean | 0.0 /100 | #290 | Tragic 11.8% |
| Central American Indians | 0.0 /100 | #291 | Tragic 11.9% |