Immigrants from Haiti vs Ukrainian Female Unemployment
COMPARE
Immigrants from Haiti
Ukrainian
Female Unemployment
Female Unemployment Comparison
Immigrants from Haiti
Ukrainians
6.1%
FEMALE UNEMPLOYMENT
0.0/ 100
METRIC RATING
300th/ 347
METRIC RANK
5.0%
FEMALE UNEMPLOYMENT
97.1/ 100
METRIC RATING
85th/ 347
METRIC RANK
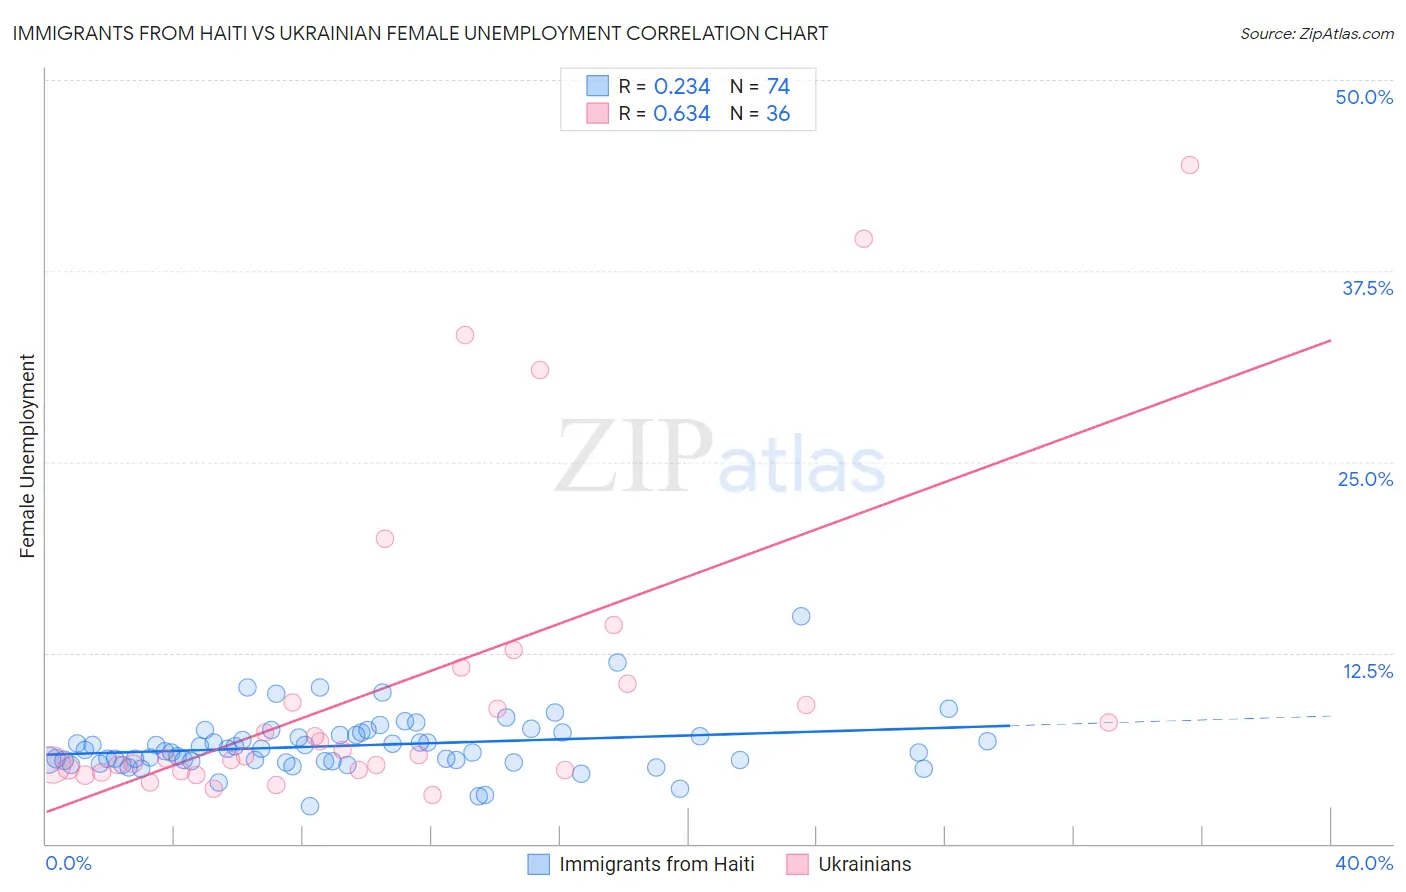
Immigrants from Haiti vs Ukrainian Female Unemployment Correlation Chart
The statistical analysis conducted on geographies consisting of 224,784,529 people shows a weak positive correlation between the proportion of Immigrants from Haiti and unemploymnet rate among females in the United States with a correlation coefficient (R) of 0.234 and weighted average of 6.1%. Similarly, the statistical analysis conducted on geographies consisting of 444,684,772 people shows a significant positive correlation between the proportion of Ukrainians and unemploymnet rate among females in the United States with a correlation coefficient (R) of 0.634 and weighted average of 5.0%, a difference of 23.1%.
Female Unemployment Correlation Summary
| Measurement | Immigrants from Haiti | Ukrainian |
| Minimum | 2.4% | 3.2% |
| Maximum | 14.9% | 44.4% |
| Range | 12.5% | 41.2% |
| Mean | 6.4% | 10.3% |
| Median | 6.1% | 5.8% |
| Interquartile 25% (IQ1) | 5.4% | 4.8% |
| Interquartile 75% (IQ3) | 7.1% | 9.9% |
| Interquartile Range (IQR) | 1.7% | 5.1% |
| Standard Deviation (Sample) | 1.9% | 10.3% |
| Standard Deviation (Population) | 1.9% | 10.2% |
Similar Demographics by Female Unemployment
Demographics Similar to Immigrants from Haiti by Female Unemployment
In terms of female unemployment, the demographic groups most similar to Immigrants from Haiti are Ute (6.1%, a difference of 0.040%), Jamaican (6.1%, a difference of 0.15%), West Indian (6.1%, a difference of 0.17%), Alaskan Athabascan (6.1%, a difference of 0.18%), and Immigrants from Latin America (6.1%, a difference of 0.20%).
| Demographics | Rating | Rank | Female Unemployment |
| Mexicans | 0.0 /100 | #293 | Tragic 6.1% |
| Immigrants | El Salvador | 0.0 /100 | #294 | Tragic 6.1% |
| Immigrants | Latin America | 0.0 /100 | #295 | Tragic 6.1% |
| Alaskan Athabascans | 0.0 /100 | #296 | Tragic 6.1% |
| West Indians | 0.0 /100 | #297 | Tragic 6.1% |
| Jamaicans | 0.0 /100 | #298 | Tragic 6.1% |
| Ute | 0.0 /100 | #299 | Tragic 6.1% |
| Immigrants | Haiti | 0.0 /100 | #300 | Tragic 6.1% |
| Immigrants | Barbados | 0.0 /100 | #301 | Tragic 6.2% |
| U.S. Virgin Islanders | 0.0 /100 | #302 | Tragic 6.2% |
| Barbadians | 0.0 /100 | #303 | Tragic 6.2% |
| Immigrants | Jamaica | 0.0 /100 | #304 | Tragic 6.2% |
| Spanish American Indians | 0.0 /100 | #305 | Tragic 6.2% |
| Immigrants | Central America | 0.0 /100 | #306 | Tragic 6.2% |
| Shoshone | 0.0 /100 | #307 | Tragic 6.2% |
Demographics Similar to Ukrainians by Female Unemployment
In terms of female unemployment, the demographic groups most similar to Ukrainians are Bolivian (5.0%, a difference of 0.010%), Canadian (5.0%, a difference of 0.040%), Immigrants from Serbia (5.0%, a difference of 0.080%), Immigrants from Australia (5.0%, a difference of 0.090%), and Venezuelan (5.0%, a difference of 0.10%).
| Demographics | Rating | Rank | Female Unemployment |
| Immigrants | Netherlands | 97.8 /100 | #78 | Exceptional 5.0% |
| Turks | 97.6 /100 | #79 | Exceptional 5.0% |
| New Zealanders | 97.4 /100 | #80 | Exceptional 5.0% |
| Filipinos | 97.3 /100 | #81 | Exceptional 5.0% |
| Immigrants | Australia | 97.3 /100 | #82 | Exceptional 5.0% |
| Immigrants | Serbia | 97.2 /100 | #83 | Exceptional 5.0% |
| Canadians | 97.2 /100 | #84 | Exceptional 5.0% |
| Ukrainians | 97.1 /100 | #85 | Exceptional 5.0% |
| Bolivians | 97.1 /100 | #86 | Exceptional 5.0% |
| Venezuelans | 96.9 /100 | #87 | Exceptional 5.0% |
| Immigrants | Sudan | 96.7 /100 | #88 | Exceptional 5.0% |
| Immigrants | Taiwan | 96.6 /100 | #89 | Exceptional 5.0% |
| Immigrants | Sweden | 96.3 /100 | #90 | Exceptional 5.0% |
| Immigrants | Japan | 96.0 /100 | #91 | Exceptional 5.0% |
| Romanians | 95.9 /100 | #92 | Exceptional 5.0% |