Immigrants from Haiti vs Immigrants from Zaire Unemployment Among Ages 30 to 34 years
COMPARE
Immigrants from Haiti
Immigrants from Zaire
Unemployment Among Ages 30 to 34 years
Unemployment Among Ages 30 to 34 years Comparison
Immigrants from Haiti
Immigrants from Zaire
6.2%
UNEMPLOYMENT AMONG AGES 30 TO 34 YEARS
0.0/ 100
METRIC RATING
268th/ 347
METRIC RANK
5.0%
UNEMPLOYMENT AMONG AGES 30 TO 34 YEARS
99.3/ 100
METRIC RATING
32nd/ 347
METRIC RANK
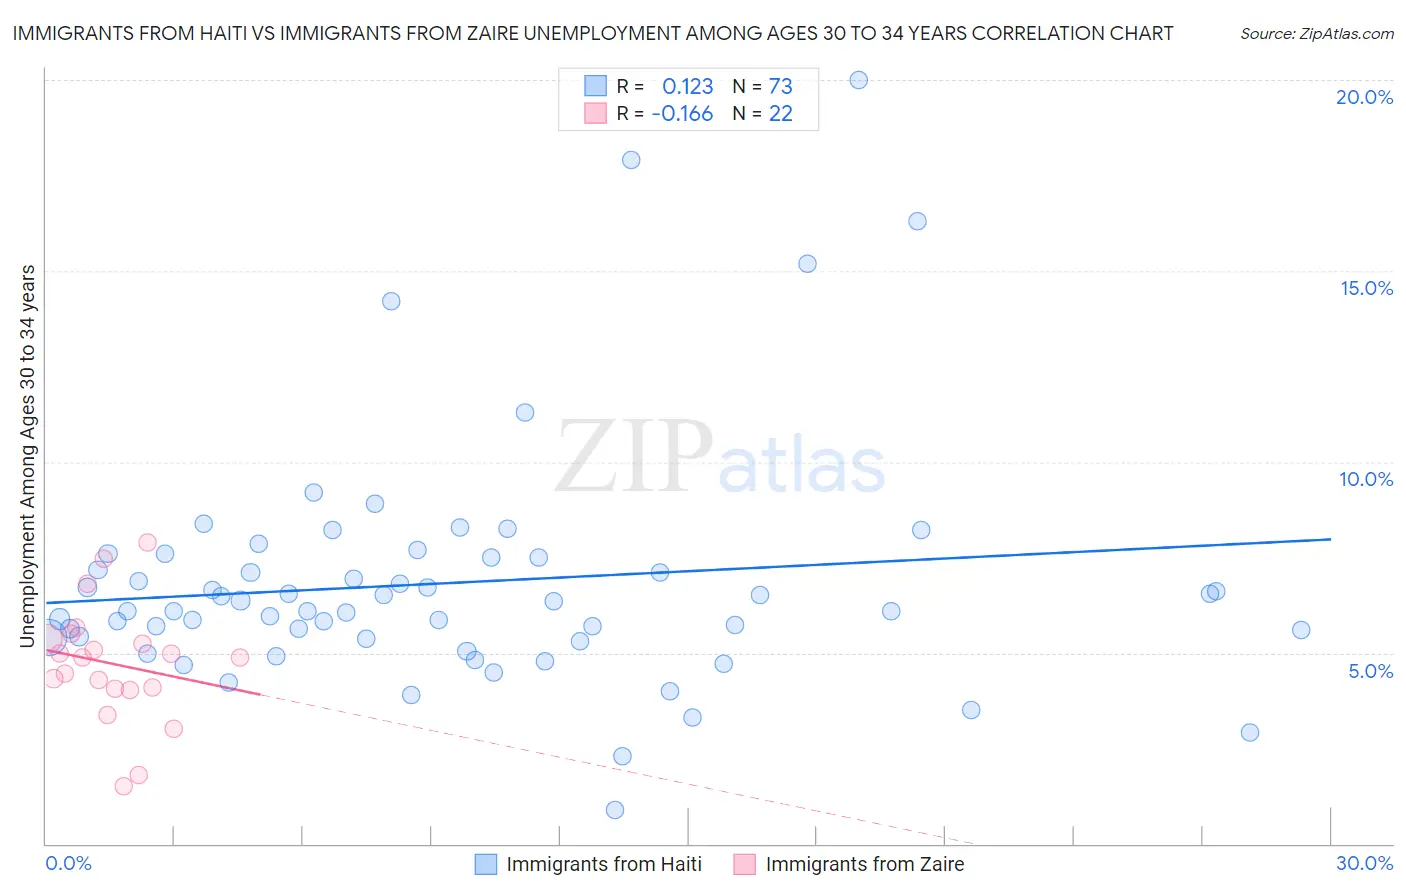
Immigrants from Haiti vs Immigrants from Zaire Unemployment Among Ages 30 to 34 years Correlation Chart
The statistical analysis conducted on geographies consisting of 217,626,533 people shows a poor positive correlation between the proportion of Immigrants from Haiti and unemployment rate among population between the ages 30 and 34 in the United States with a correlation coefficient (R) of 0.123 and weighted average of 6.2%. Similarly, the statistical analysis conducted on geographies consisting of 105,959,857 people shows a poor negative correlation between the proportion of Immigrants from Zaire and unemployment rate among population between the ages 30 and 34 in the United States with a correlation coefficient (R) of -0.166 and weighted average of 5.0%, a difference of 25.0%.
Unemployment Among Ages 30 to 34 years Correlation Summary
| Measurement | Immigrants from Haiti | Immigrants from Zaire |
| Minimum | 0.90% | 1.5% |
| Maximum | 20.0% | 7.9% |
| Range | 19.1% | 6.4% |
| Mean | 6.8% | 4.7% |
| Median | 6.1% | 4.9% |
| Interquartile 25% (IQ1) | 5.4% | 4.0% |
| Interquartile 75% (IQ3) | 7.5% | 5.4% |
| Interquartile Range (IQR) | 2.1% | 1.3% |
| Standard Deviation (Sample) | 3.2% | 1.5% |
| Standard Deviation (Population) | 3.2% | 1.5% |
Similar Demographics by Unemployment Among Ages 30 to 34 years
Demographics Similar to Immigrants from Haiti by Unemployment Among Ages 30 to 34 years
In terms of unemployment among ages 30 to 34 years, the demographic groups most similar to Immigrants from Haiti are Immigrants from Mexico (6.2%, a difference of 0.16%), French American Indian (6.3%, a difference of 0.30%), Immigrants from Senegal (6.3%, a difference of 0.31%), Seminole (6.2%, a difference of 0.35%), and American (6.2%, a difference of 0.45%).
| Demographics | Rating | Rank | Unemployment Among Ages 30 to 34 years |
| Immigrants | Western Africa | 0.1 /100 | #261 | Tragic 6.2% |
| Immigrants | Central America | 0.1 /100 | #262 | Tragic 6.2% |
| Spanish Americans | 0.0 /100 | #263 | Tragic 6.2% |
| Chickasaw | 0.0 /100 | #264 | Tragic 6.2% |
| Americans | 0.0 /100 | #265 | Tragic 6.2% |
| Seminole | 0.0 /100 | #266 | Tragic 6.2% |
| Immigrants | Mexico | 0.0 /100 | #267 | Tragic 6.2% |
| Immigrants | Haiti | 0.0 /100 | #268 | Tragic 6.2% |
| French American Indians | 0.0 /100 | #269 | Tragic 6.3% |
| Immigrants | Senegal | 0.0 /100 | #270 | Tragic 6.3% |
| Comanche | 0.0 /100 | #271 | Tragic 6.3% |
| Blackfeet | 0.0 /100 | #272 | Tragic 6.3% |
| Ottawa | 0.0 /100 | #273 | Tragic 6.3% |
| U.S. Virgin Islanders | 0.0 /100 | #274 | Tragic 6.3% |
| Ecuadorians | 0.0 /100 | #275 | Tragic 6.3% |
Demographics Similar to Immigrants from Zaire by Unemployment Among Ages 30 to 34 years
In terms of unemployment among ages 30 to 34 years, the demographic groups most similar to Immigrants from Zaire are Somali (5.0%, a difference of 0.040%), Immigrants from Saudi Arabia (5.0%, a difference of 0.10%), Norwegian (5.0%, a difference of 0.13%), Latvian (5.0%, a difference of 0.14%), and German Russian (5.0%, a difference of 0.15%).
| Demographics | Rating | Rank | Unemployment Among Ages 30 to 34 years |
| Immigrants | Singapore | 99.5 /100 | #25 | Exceptional 5.0% |
| Immigrants | Kuwait | 99.5 /100 | #26 | Exceptional 5.0% |
| Danes | 99.5 /100 | #27 | Exceptional 5.0% |
| Immigrants | Cuba | 99.4 /100 | #28 | Exceptional 5.0% |
| German Russians | 99.4 /100 | #29 | Exceptional 5.0% |
| Norwegians | 99.4 /100 | #30 | Exceptional 5.0% |
| Somalis | 99.3 /100 | #31 | Exceptional 5.0% |
| Immigrants | Zaire | 99.3 /100 | #32 | Exceptional 5.0% |
| Immigrants | Saudi Arabia | 99.3 /100 | #33 | Exceptional 5.0% |
| Latvians | 99.3 /100 | #34 | Exceptional 5.0% |
| Immigrants | Ethiopia | 99.2 /100 | #35 | Exceptional 5.0% |
| Czechs | 99.2 /100 | #36 | Exceptional 5.0% |
| Immigrants | Turkey | 99.0 /100 | #37 | Exceptional 5.0% |
| Sri Lankans | 99.0 /100 | #38 | Exceptional 5.0% |
| Fijians | 99.0 /100 | #39 | Exceptional 5.0% |