Immigrants from Haiti vs Immigrants from Ecuador Unemployment Among Ages 60 to 64 years
COMPARE
Immigrants from Haiti
Immigrants from Ecuador
Unemployment Among Ages 60 to 64 years
Unemployment Among Ages 60 to 64 years Comparison
Immigrants from Haiti
Immigrants from Ecuador
5.2%
UNEMPLOYMENT AMONG AGES 60 TO 64 YEARS
0.0/ 100
METRIC RATING
281st/ 347
METRIC RANK
5.8%
UNEMPLOYMENT AMONG AGES 60 TO 64 YEARS
0.0/ 100
METRIC RATING
324th/ 347
METRIC RANK
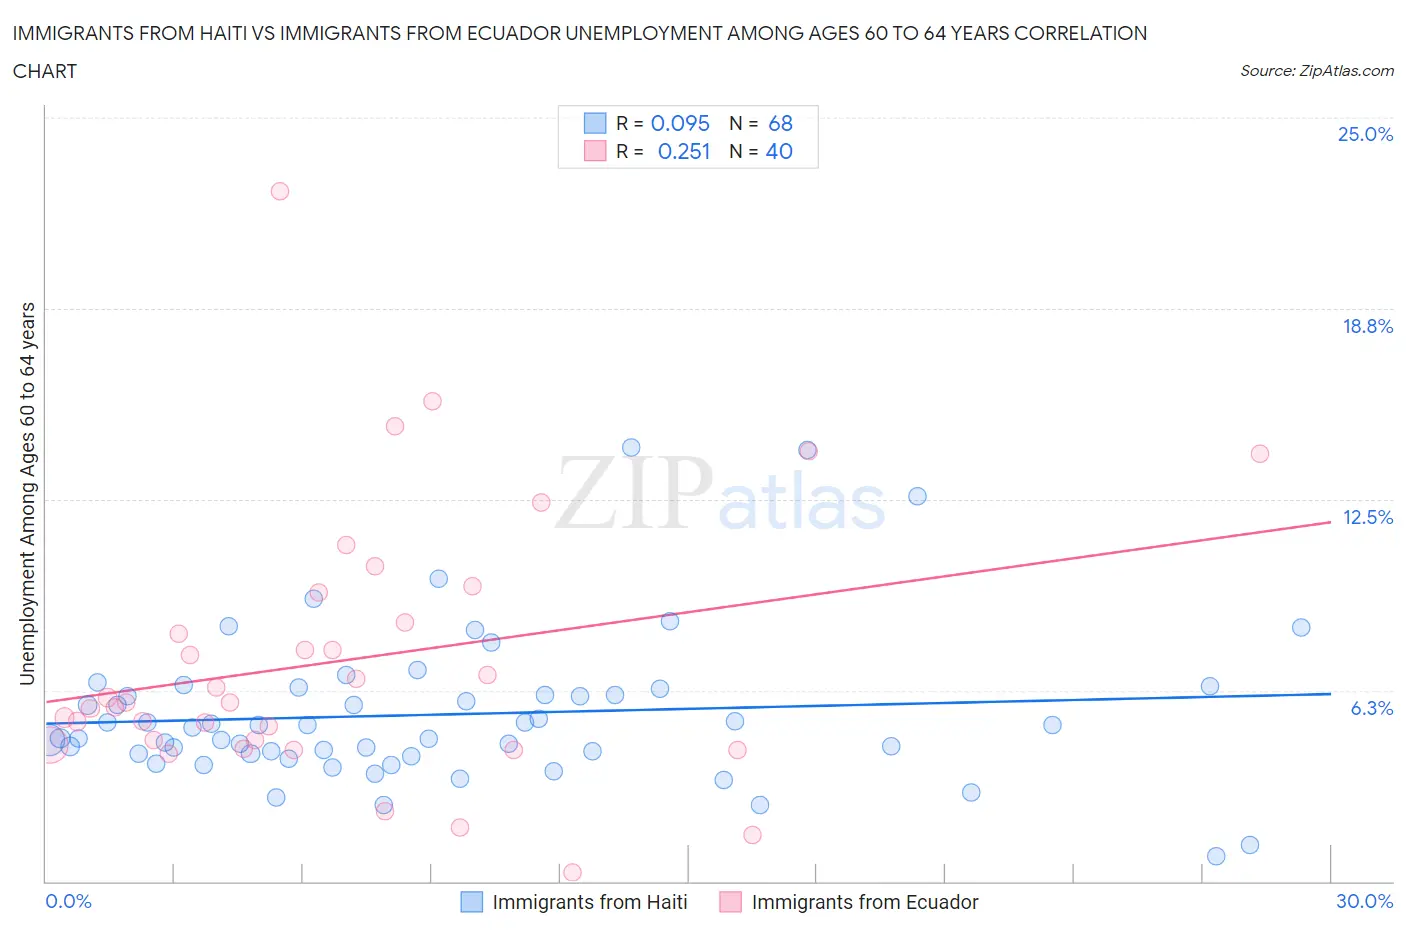
Immigrants from Haiti vs Immigrants from Ecuador Unemployment Among Ages 60 to 64 years Correlation Chart
The statistical analysis conducted on geographies consisting of 212,174,289 people shows a slight positive correlation between the proportion of Immigrants from Haiti and unemployment rate among population between the ages 60 and 64 in the United States with a correlation coefficient (R) of 0.095 and weighted average of 5.2%. Similarly, the statistical analysis conducted on geographies consisting of 255,083,345 people shows a weak positive correlation between the proportion of Immigrants from Ecuador and unemployment rate among population between the ages 60 and 64 in the United States with a correlation coefficient (R) of 0.251 and weighted average of 5.8%, a difference of 11.0%.
Unemployment Among Ages 60 to 64 years Correlation Summary
| Measurement | Immigrants from Haiti | Immigrants from Ecuador |
| Minimum | 0.80% | 0.30% |
| Maximum | 14.2% | 22.6% |
| Range | 13.4% | 22.3% |
| Mean | 5.5% | 7.2% |
| Median | 5.1% | 5.8% |
| Interquartile 25% (IQ1) | 4.2% | 4.5% |
| Interquartile 75% (IQ3) | 6.2% | 9.0% |
| Interquartile Range (IQR) | 2.0% | 4.4% |
| Standard Deviation (Sample) | 2.5% | 4.4% |
| Standard Deviation (Population) | 2.4% | 4.3% |
Similar Demographics by Unemployment Among Ages 60 to 64 years
Demographics Similar to Immigrants from Haiti by Unemployment Among Ages 60 to 64 years
In terms of unemployment among ages 60 to 64 years, the demographic groups most similar to Immigrants from Haiti are Mexican (5.2%, a difference of 0.0%), Nepalese (5.2%, a difference of 0.050%), French American Indian (5.2%, a difference of 0.050%), Guatemalan (5.2%, a difference of 0.25%), and Immigrants from Guatemala (5.3%, a difference of 0.44%).
| Demographics | Rating | Rank | Unemployment Among Ages 60 to 64 years |
| Hopi | 0.1 /100 | #274 | Tragic 5.2% |
| Immigrants | Hong Kong | 0.1 /100 | #275 | Tragic 5.2% |
| Central Americans | 0.0 /100 | #276 | Tragic 5.2% |
| Immigrants | Caribbean | 0.0 /100 | #277 | Tragic 5.2% |
| Guatemalans | 0.0 /100 | #278 | Tragic 5.2% |
| Nepalese | 0.0 /100 | #279 | Tragic 5.2% |
| French American Indians | 0.0 /100 | #280 | Tragic 5.2% |
| Immigrants | Haiti | 0.0 /100 | #281 | Tragic 5.2% |
| Mexicans | 0.0 /100 | #282 | Tragic 5.2% |
| Immigrants | Guatemala | 0.0 /100 | #283 | Tragic 5.3% |
| Taiwanese | 0.0 /100 | #284 | Tragic 5.3% |
| West Indians | 0.0 /100 | #285 | Tragic 5.3% |
| Mexican American Indians | 0.0 /100 | #286 | Tragic 5.3% |
| Salvadorans | 0.0 /100 | #287 | Tragic 5.3% |
| Trinidadians and Tobagonians | 0.0 /100 | #288 | Tragic 5.3% |
Demographics Similar to Immigrants from Ecuador by Unemployment Among Ages 60 to 64 years
In terms of unemployment among ages 60 to 64 years, the demographic groups most similar to Immigrants from Ecuador are Paiute (5.8%, a difference of 0.010%), Alsatian (5.8%, a difference of 0.35%), Immigrants from St. Vincent and the Grenadines (5.9%, a difference of 0.95%), Ecuadorian (5.8%, a difference of 0.96%), and Immigrants from Grenada (5.9%, a difference of 1.0%).
| Demographics | Rating | Rank | Unemployment Among Ages 60 to 64 years |
| Shoshone | 0.0 /100 | #317 | Tragic 5.7% |
| Natives/Alaskans | 0.0 /100 | #318 | Tragic 5.7% |
| Immigrants | Belize | 0.0 /100 | #319 | Tragic 5.7% |
| Colville | 0.0 /100 | #320 | Tragic 5.7% |
| Dutch West Indians | 0.0 /100 | #321 | Tragic 5.7% |
| Ecuadorians | 0.0 /100 | #322 | Tragic 5.8% |
| Alsatians | 0.0 /100 | #323 | Tragic 5.8% |
| Immigrants | Ecuador | 0.0 /100 | #324 | Tragic 5.8% |
| Paiute | 0.0 /100 | #325 | Tragic 5.8% |
| Immigrants | St. Vincent and the Grenadines | 0.0 /100 | #326 | Tragic 5.9% |
| Immigrants | Grenada | 0.0 /100 | #327 | Tragic 5.9% |
| Apache | 0.0 /100 | #328 | Tragic 6.0% |
| Immigrants | Bangladesh | 0.0 /100 | #329 | Tragic 6.0% |
| Immigrants | Armenia | 0.0 /100 | #330 | Tragic 6.0% |
| Yakama | 0.0 /100 | #331 | Tragic 6.0% |