Immigrants from Guatemala vs Tongan Unemployment Among Ages 30 to 34 years
COMPARE
Immigrants from Guatemala
Tongan
Unemployment Among Ages 30 to 34 years
Unemployment Among Ages 30 to 34 years Comparison
Immigrants from Guatemala
Tongans
6.0%
UNEMPLOYMENT AMONG AGES 30 TO 34 YEARS
0.3/ 100
METRIC RATING
248th/ 347
METRIC RANK
4.8%
UNEMPLOYMENT AMONG AGES 30 TO 34 YEARS
99.9/ 100
METRIC RATING
10th/ 347
METRIC RANK
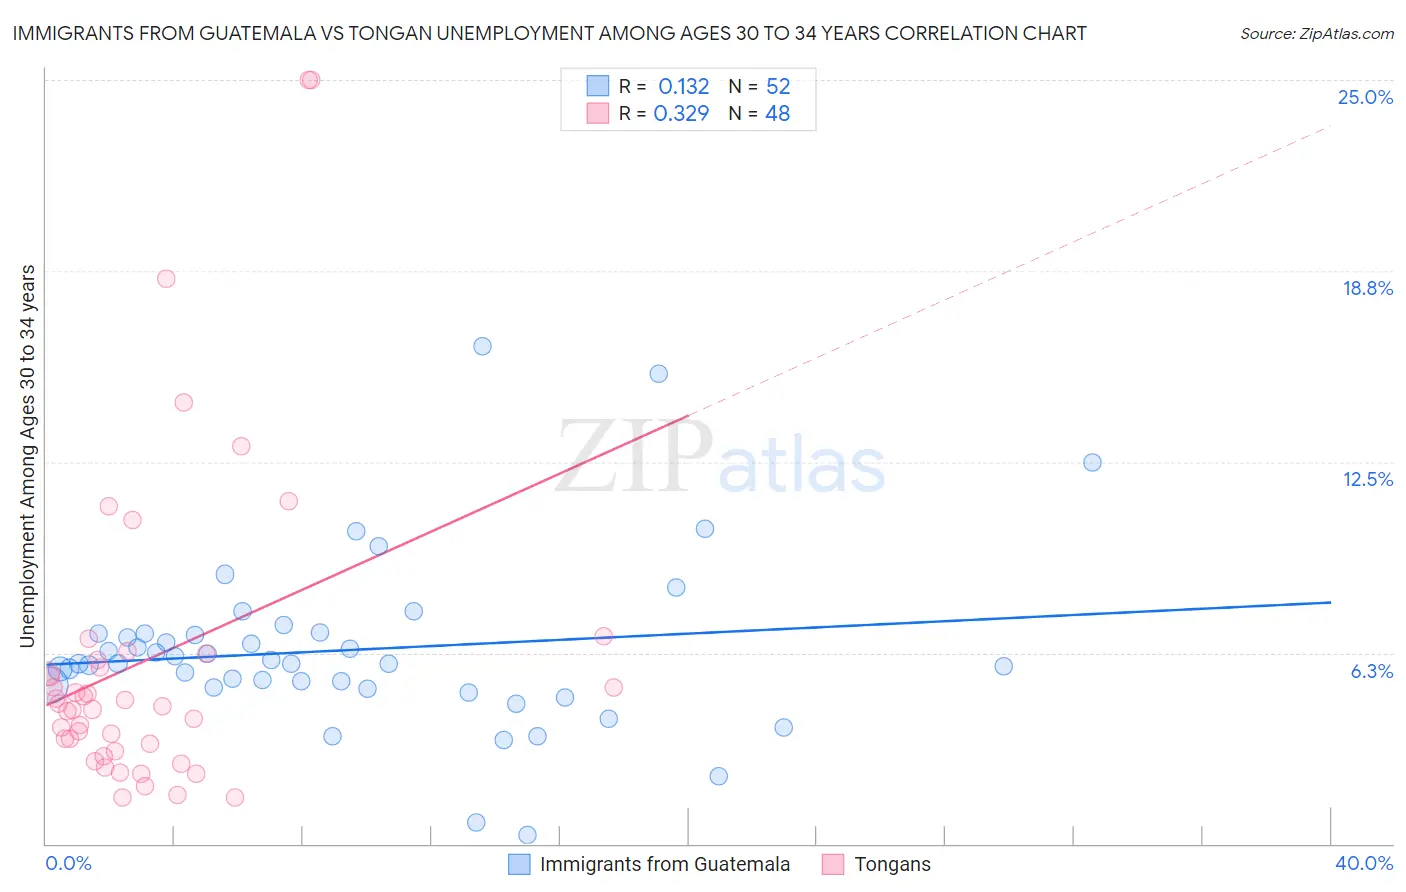
Immigrants from Guatemala vs Tongan Unemployment Among Ages 30 to 34 years Correlation Chart
The statistical analysis conducted on geographies consisting of 359,081,964 people shows a poor positive correlation between the proportion of Immigrants from Guatemala and unemployment rate among population between the ages 30 and 34 in the United States with a correlation coefficient (R) of 0.132 and weighted average of 6.0%. Similarly, the statistical analysis conducted on geographies consisting of 101,378,326 people shows a mild positive correlation between the proportion of Tongans and unemployment rate among population between the ages 30 and 34 in the United States with a correlation coefficient (R) of 0.329 and weighted average of 4.8%, a difference of 26.6%.
Unemployment Among Ages 30 to 34 years Correlation Summary
| Measurement | Immigrants from Guatemala | Tongan |
| Minimum | 0.30% | 1.5% |
| Maximum | 16.3% | 25.0% |
| Range | 16.0% | 23.5% |
| Mean | 6.3% | 6.1% |
| Median | 5.9% | 4.5% |
| Interquartile 25% (IQ1) | 5.1% | 3.1% |
| Interquartile 75% (IQ3) | 6.9% | 6.1% |
| Interquartile Range (IQR) | 1.7% | 3.0% |
| Standard Deviation (Sample) | 2.9% | 5.3% |
| Standard Deviation (Population) | 2.8% | 5.2% |
Similar Demographics by Unemployment Among Ages 30 to 34 years
Demographics Similar to Immigrants from Guatemala by Unemployment Among Ages 30 to 34 years
In terms of unemployment among ages 30 to 34 years, the demographic groups most similar to Immigrants from Guatemala are Nigerian (6.0%, a difference of 0.0%), Honduran (6.0%, a difference of 0.0%), Ghanaian (6.0%, a difference of 0.070%), Immigrants from Honduras (6.0%, a difference of 0.10%), and Subsaharan African (6.0%, a difference of 0.25%).
| Demographics | Rating | Rank | Unemployment Among Ages 30 to 34 years |
| Immigrants | El Salvador | 0.5 /100 | #241 | Tragic 6.0% |
| Guatemalans | 0.4 /100 | #242 | Tragic 6.0% |
| Immigrants | Liberia | 0.4 /100 | #243 | Tragic 6.0% |
| Immigrants | Micronesia | 0.3 /100 | #244 | Tragic 6.0% |
| Sub-Saharan Africans | 0.3 /100 | #245 | Tragic 6.0% |
| Ghanaians | 0.3 /100 | #246 | Tragic 6.0% |
| Nigerians | 0.3 /100 | #247 | Tragic 6.0% |
| Immigrants | Guatemala | 0.3 /100 | #248 | Tragic 6.0% |
| Hondurans | 0.3 /100 | #249 | Tragic 6.0% |
| Immigrants | Honduras | 0.3 /100 | #250 | Tragic 6.0% |
| Tlingit-Haida | 0.2 /100 | #251 | Tragic 6.0% |
| Potawatomi | 0.2 /100 | #252 | Tragic 6.0% |
| Immigrants | Nonimmigrants | 0.2 /100 | #253 | Tragic 6.1% |
| Armenians | 0.1 /100 | #254 | Tragic 6.1% |
| Immigrants | Portugal | 0.1 /100 | #255 | Tragic 6.1% |
Demographics Similar to Tongans by Unemployment Among Ages 30 to 34 years
In terms of unemployment among ages 30 to 34 years, the demographic groups most similar to Tongans are Immigrants from Bolivia (4.8%, a difference of 0.030%), Bulgarian (4.7%, a difference of 0.18%), Immigrants from Eritrea (4.7%, a difference of 0.49%), Thai (4.7%, a difference of 0.67%), and Immigrants from Bosnia and Herzegovina (4.7%, a difference of 0.87%).
| Demographics | Rating | Rank | Unemployment Among Ages 30 to 34 years |
| Immigrants | Venezuela | 100.0 /100 | #3 | Exceptional 4.6% |
| Immigrants | Nepal | 100.0 /100 | #4 | Exceptional 4.7% |
| Venezuelans | 100.0 /100 | #5 | Exceptional 4.7% |
| Immigrants | Bosnia and Herzegovina | 100.0 /100 | #6 | Exceptional 4.7% |
| Thais | 100.0 /100 | #7 | Exceptional 4.7% |
| Immigrants | Eritrea | 100.0 /100 | #8 | Exceptional 4.7% |
| Bulgarians | 99.9 /100 | #9 | Exceptional 4.7% |
| Tongans | 99.9 /100 | #10 | Exceptional 4.8% |
| Immigrants | Bolivia | 99.9 /100 | #11 | Exceptional 4.8% |
| Filipinos | 99.9 /100 | #12 | Exceptional 4.8% |
| Cambodians | 99.9 /100 | #13 | Exceptional 4.8% |
| Luxembourgers | 99.9 /100 | #14 | Exceptional 4.8% |
| Okinawans | 99.9 /100 | #15 | Exceptional 4.8% |
| Zimbabweans | 99.9 /100 | #16 | Exceptional 4.8% |
| Immigrants | Bulgaria | 99.9 /100 | #17 | Exceptional 4.8% |