Immigrants from Guatemala vs Assyrian/Chaldean/Syriac Unemployment Among Ages 55 to 59 years
COMPARE
Immigrants from Guatemala
Assyrian/Chaldean/Syriac
Unemployment Among Ages 55 to 59 years
Unemployment Among Ages 55 to 59 years Comparison
Immigrants from Guatemala
Assyrians/Chaldeans/Syriacs
5.3%
UNEMPLOYMENT AMONG AGES 55 TO 59 YEARS
0.0/ 100
METRIC RATING
287th/ 347
METRIC RANK
4.5%
UNEMPLOYMENT AMONG AGES 55 TO 59 YEARS
99.9/ 100
METRIC RATING
38th/ 347
METRIC RANK
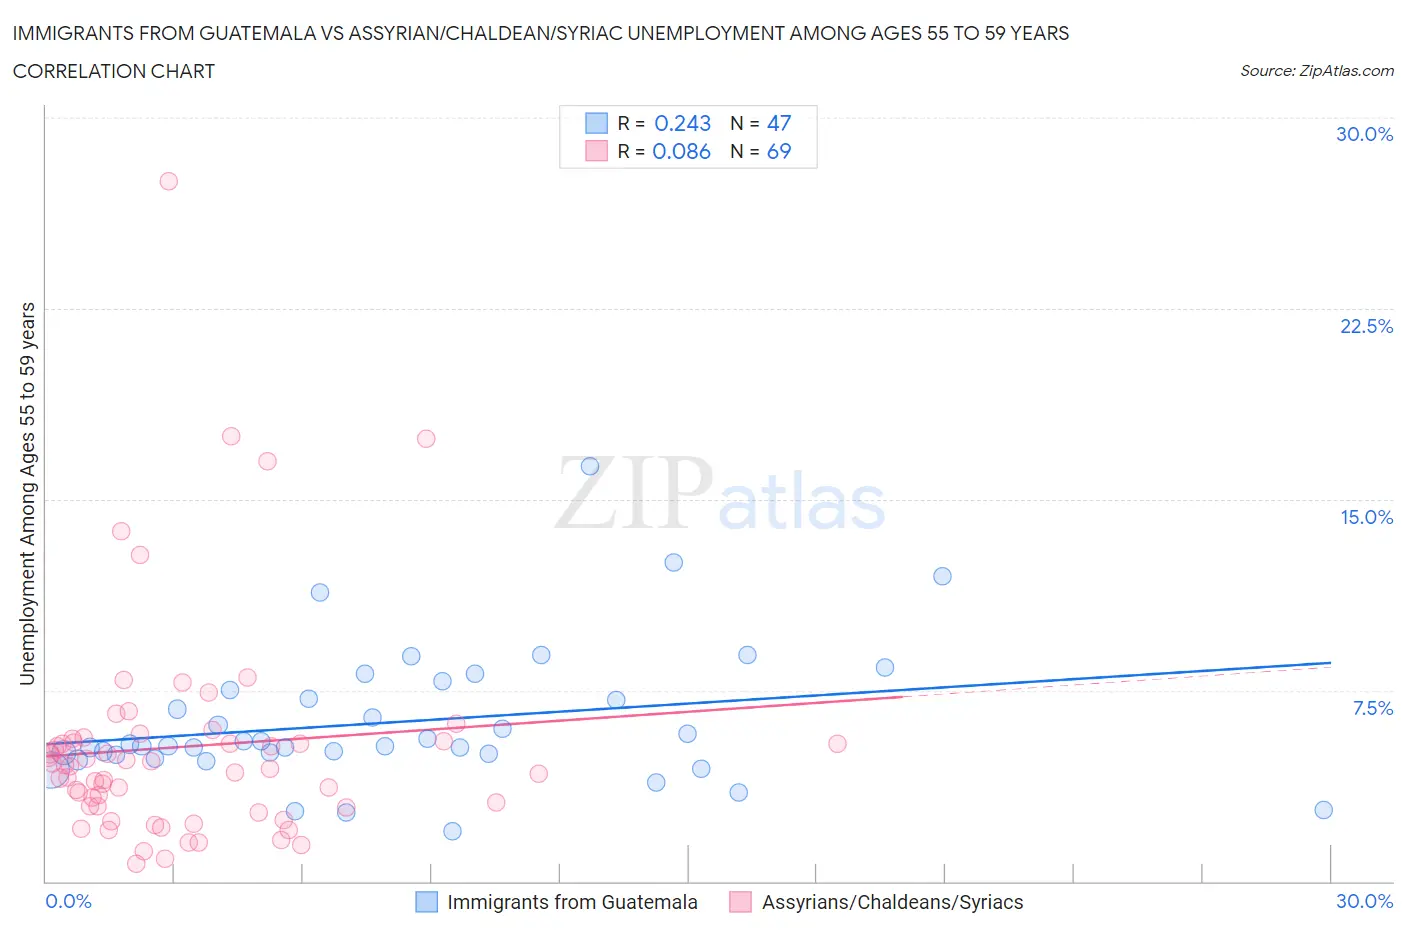
Immigrants from Guatemala vs Assyrian/Chaldean/Syriac Unemployment Among Ages 55 to 59 years Correlation Chart
The statistical analysis conducted on geographies consisting of 352,603,717 people shows a weak positive correlation between the proportion of Immigrants from Guatemala and unemployment rate among population between the ages 55 and 59 in the United States with a correlation coefficient (R) of 0.243 and weighted average of 5.3%. Similarly, the statistical analysis conducted on geographies consisting of 108,497,216 people shows a slight positive correlation between the proportion of Assyrians/Chaldeans/Syriacs and unemployment rate among population between the ages 55 and 59 in the United States with a correlation coefficient (R) of 0.086 and weighted average of 4.5%, a difference of 17.9%.
Unemployment Among Ages 55 to 59 years Correlation Summary
| Measurement | Immigrants from Guatemala | Assyrian/Chaldean/Syriac |
| Minimum | 2.0% | 0.69% |
| Maximum | 16.3% | 27.5% |
| Range | 14.3% | 26.8% |
| Mean | 6.3% | 5.3% |
| Median | 5.3% | 4.5% |
| Interquartile 25% (IQ1) | 5.0% | 2.9% |
| Interquartile 75% (IQ3) | 7.5% | 5.6% |
| Interquartile Range (IQR) | 2.5% | 2.6% |
| Standard Deviation (Sample) | 2.7% | 4.4% |
| Standard Deviation (Population) | 2.7% | 4.4% |
Similar Demographics by Unemployment Among Ages 55 to 59 years
Demographics Similar to Immigrants from Guatemala by Unemployment Among Ages 55 to 59 years
In terms of unemployment among ages 55 to 59 years, the demographic groups most similar to Immigrants from Guatemala are Immigrants from Israel (5.3%, a difference of 0.010%), Immigrants from Ghana (5.3%, a difference of 0.020%), Immigrants from Central America (5.3%, a difference of 0.070%), Sioux (5.3%, a difference of 0.10%), and Armenian (5.3%, a difference of 0.14%).
| Demographics | Rating | Rank | Unemployment Among Ages 55 to 59 years |
| Immigrants | Uzbekistan | 0.0 /100 | #280 | Tragic 5.3% |
| Guatemalans | 0.0 /100 | #281 | Tragic 5.3% |
| Immigrants | Trinidad and Tobago | 0.0 /100 | #282 | Tragic 5.3% |
| Apache | 0.0 /100 | #283 | Tragic 5.3% |
| Ghanaians | 0.0 /100 | #284 | Tragic 5.3% |
| Armenians | 0.0 /100 | #285 | Tragic 5.3% |
| Immigrants | Ghana | 0.0 /100 | #286 | Tragic 5.3% |
| Immigrants | Guatemala | 0.0 /100 | #287 | Tragic 5.3% |
| Immigrants | Israel | 0.0 /100 | #288 | Tragic 5.3% |
| Immigrants | Central America | 0.0 /100 | #289 | Tragic 5.3% |
| Sioux | 0.0 /100 | #290 | Tragic 5.3% |
| Trinidadians and Tobagonians | 0.0 /100 | #291 | Tragic 5.3% |
| British West Indians | 0.0 /100 | #292 | Tragic 5.3% |
| Immigrants | Grenada | 0.0 /100 | #293 | Tragic 5.3% |
| Cajuns | 0.0 /100 | #294 | Tragic 5.3% |
Demographics Similar to Assyrians/Chaldeans/Syriacs by Unemployment Among Ages 55 to 59 years
In terms of unemployment among ages 55 to 59 years, the demographic groups most similar to Assyrians/Chaldeans/Syriacs are Ethiopian (4.5%, a difference of 0.18%), Immigrants from Bulgaria (4.5%, a difference of 0.18%), English (4.5%, a difference of 0.26%), Cypriot (4.5%, a difference of 0.27%), and Thai (4.5%, a difference of 0.29%).
| Demographics | Rating | Rank | Unemployment Among Ages 55 to 59 years |
| Germans | 99.9 /100 | #31 | Exceptional 4.5% |
| Immigrants | Ethiopia | 99.9 /100 | #32 | Exceptional 4.5% |
| Belgians | 99.9 /100 | #33 | Exceptional 4.5% |
| Thais | 99.9 /100 | #34 | Exceptional 4.5% |
| Cypriots | 99.9 /100 | #35 | Exceptional 4.5% |
| Ethiopians | 99.9 /100 | #36 | Exceptional 4.5% |
| Immigrants | Bulgaria | 99.9 /100 | #37 | Exceptional 4.5% |
| Assyrians/Chaldeans/Syriacs | 99.9 /100 | #38 | Exceptional 4.5% |
| English | 99.9 /100 | #39 | Exceptional 4.5% |
| Swiss | 99.8 /100 | #40 | Exceptional 4.5% |
| Luxembourgers | 99.8 /100 | #41 | Exceptional 4.5% |
| Immigrants | Kuwait | 99.8 /100 | #42 | Exceptional 4.5% |
| Immigrants | Korea | 99.8 /100 | #43 | Exceptional 4.5% |
| Europeans | 99.8 /100 | #44 | Exceptional 4.5% |
| British | 99.8 /100 | #45 | Exceptional 4.5% |