Immigrants from Grenada vs Immigrants from South Africa Unemployment Among Youth under 25 years

COMPARE

Immigrants from Grenada
Race
Ancestry
AfghanAfricanAlaska NativeAlaskan AthabascanAlbanianAleutAlsatianAmericanApacheArabArapahoArgentineanArmenianAssyrian/Chaldean/SyriacAustralianAustrianBahamianBangladeshiBarbadianBasqueBelgianBelizeanBermudanBhutaneseBlackfeetBolivianBrazilianBritishBritish West IndianBulgarianBurmeseCajunCambodianCanadianCape VerdeanCarpatho RusynCelticCentral AmericanCentral American IndianCherokeeCheyenneChickasawChileanChineseChippewaChoctawColombianColvilleComancheCosta RicanCreeCreekCroatianCrowCubanCypriotCzechCzechoslovakianDanishDelawareDominicanDutchDutch West IndianEastern EuropeanEcuadorianEgyptianEnglishEstonianEthiopianEuropeanFijianFilipinoFinnishFrenchFrench American IndianFrench CanadianGermanGerman RussianGhanaianGreekGuamanian/ChamorroGuatemalanGuyaneseHaitianHmongHonduranHopiHoumaHungarianIcelanderIndian (Asian)IndonesianInupiatIranianIraqiIrishIroquoisIsraeliItalianJamaicanJapaneseJordanianKenyanKiowaKoreanLaotianLatvianLebaneseLiberianLithuanianLumbeeLuxembourgerMacedonianMalaysianMalteseMarshalleseMenomineeMexicanMexican American IndianMongolianMoroccanNative HawaiianNavajoNepaleseNew ZealanderNicaraguanNigerianNorthern EuropeanNorwegianOkinawanOsageOttawaPaiutePakistaniPalestinianPanamanianParaguayanPennsylvania GermanPeruvianPimaPolishPortuguesePotawatomiPuebloPuerto RicanPuget Sound SalishRomanianRussianSalvadoranSamoanScandinavianScotch-IrishScottishSeminoleSenegaleseSerbianShoshoneSierra LeoneanSiouxSlavicSlovakSloveneSomaliSouth AfricanSouth AmericanSouth American IndianSoviet UnionSpaniardSpanishSpanish AmericanSpanish American IndianSri LankanSubsaharan AfricanSudaneseSwedishSwissSyrianTaiwaneseThaiTlingit-HaidaTohono O'OdhamTonganTrinidadian and TobagonianTsimshianTurkishU.S. Virgin IslanderUgandanUkrainianUruguayanUteVenezuelanVietnameseWelshWest IndianYakamaYaquiYugoslavianYumanYup'ikZimbabwean
Immigration
NonimmigrantsImmigrantsAfghanistanAfricaAlbaniaArgentinaArmeniaAsiaAustraliaAustriaBahamasBangladeshBarbadosBelarusBelgiumBelizeBoliviaBosnia and HerzegovinaBrazilBulgariaBurma/MyanmarCabo VerdeCambodiaCameroonCanadaCaribbeanCentral AmericaChileChinaColombiaCongoCosta RicaCroatiaCubaCzechoslovakiaDenmarkDominicaDominican RepublicEastern AfricaEastern AsiaEastern EuropeEcuadorEgyptEl SalvadorEnglandEritreaEthiopiaEuropeFijiFranceGermanyGhanaGreeceGrenadaGuatemalaGuyanaHaitiHondurasHong KongHungaryIndiaIndonesiaIranIraqIrelandIsraelItalyJamaicaJapanJordanKazakhstanKenyaKoreaKuwaitLaosLatin AmericaLatviaLebanonLiberiaLithuaniaMalaysiaMexicoMicronesiaMiddle AfricaMoldovaMoroccoNepalNetherlandsNicaraguaNigeriaNorth AmericaNorth MacedoniaNorthern AfricaNorthern EuropeNorwayOceaniaPakistanPanamaPeruPhilippinesPolandPortugalRomaniaRussiaSaudi ArabiaScotlandSenegalSerbiaSierra LeoneSingaporeSomaliaSouth AmericaSouth Central AsiaSouth Eastern AsiaSouthern EuropeSpainSri LankaSt. Vincent and the GrenadinesSudanSwedenSwitzerlandSyriaTaiwanThailandTrinidad and TobagoTurkeyUgandaUkraineUruguayUzbekistanVenezuelaVietnamWest IndiesWestern AfricaWestern AsiaWestern EuropeYemenZaireZimbabweAzores
Immigrants from South Africa
Race
Ancestry
AfghanAfricanAlaska NativeAlaskan AthabascanAlbanianAleutAlsatianAmericanApacheArabArapahoArgentineanArmenianAssyrian/Chaldean/SyriacAustralianAustrianBahamianBangladeshiBarbadianBasqueBelgianBelizeanBermudanBhutaneseBlackfeetBolivianBrazilianBritishBritish West IndianBulgarianBurmeseCajunCambodianCanadianCape VerdeanCarpatho RusynCelticCentral AmericanCentral American IndianCherokeeCheyenneChickasawChileanChineseChippewaChoctawColombianColvilleComancheCosta RicanCreeCreekCroatianCrowCubanCypriotCzechCzechoslovakianDanishDelawareDominicanDutchDutch West IndianEastern EuropeanEcuadorianEgyptianEnglishEstonianEthiopianEuropeanFijianFilipinoFinnishFrenchFrench American IndianFrench CanadianGermanGerman RussianGhanaianGreekGuamanian/ChamorroGuatemalanGuyaneseHaitianHmongHonduranHopiHoumaHungarianIcelanderIndian (Asian)IndonesianInupiatIranianIraqiIrishIroquoisIsraeliItalianJamaicanJapaneseJordanianKenyanKiowaKoreanLaotianLatvianLebaneseLiberianLithuanianLumbeeLuxembourgerMacedonianMalaysianMalteseMarshalleseMenomineeMexicanMexican American IndianMongolianMoroccanNative HawaiianNavajoNepaleseNew ZealanderNicaraguanNigerianNorthern EuropeanNorwegianOkinawanOsageOttawaPaiutePakistaniPalestinianPanamanianParaguayanPennsylvania GermanPeruvianPimaPolishPortuguesePotawatomiPuebloPuerto RicanPuget Sound SalishRomanianRussianSalvadoranSamoanScandinavianScotch-IrishScottishSeminoleSenegaleseSerbianShoshoneSierra LeoneanSiouxSlavicSlovakSloveneSomaliSouth AfricanSouth AmericanSouth American IndianSoviet UnionSpaniardSpanishSpanish AmericanSpanish American IndianSri LankanSubsaharan AfricanSudaneseSwedishSwissSyrianTaiwaneseThaiTlingit-HaidaTohono O'OdhamTonganTrinidadian and TobagonianTsimshianTurkishU.S. Virgin IslanderUgandanUkrainianUruguayanUteVenezuelanVietnameseWelshWest IndianYakamaYaquiYugoslavianYumanYup'ikZimbabwean
Immigration
NonimmigrantsImmigrantsAfghanistanAfricaAlbaniaArgentinaArmeniaAsiaAustraliaAustriaBahamasBangladeshBarbadosBelarusBelgiumBelizeBoliviaBosnia and HerzegovinaBrazilBulgariaBurma/MyanmarCabo VerdeCambodiaCameroonCanadaCaribbeanCentral AmericaChileChinaColombiaCongoCosta RicaCroatiaCubaCzechoslovakiaDenmarkDominicaDominican RepublicEastern AfricaEastern AsiaEastern EuropeEcuadorEgyptEl SalvadorEnglandEritreaEthiopiaEuropeFijiFranceGermanyGhanaGreeceGuatemalaGuyanaHaitiHondurasHong KongHungaryIndiaIndonesiaIranIraqIrelandIsraelItalyJamaicaJapanJordanKazakhstanKenyaKoreaKuwaitLaosLatin AmericaLatviaLebanonLiberiaLithuaniaMalaysiaMexicoMicronesiaMiddle AfricaMoldovaMoroccoNepalNetherlandsNicaraguaNigeriaNorth AmericaNorth MacedoniaNorthern AfricaNorthern EuropeNorwayOceaniaPakistanPanamaPeruPhilippinesPolandPortugalRomaniaRussiaSaudi ArabiaScotlandSenegalSerbiaSierra LeoneSingaporeSomaliaSouth AfricaSouth AmericaSouth Central AsiaSouth Eastern AsiaSouthern EuropeSpainSri LankaSt. Vincent and the GrenadinesSudanSwedenSwitzerlandSyriaTaiwanThailandTrinidad and TobagoTurkeyUgandaUkraineUruguayUzbekistanVenezuelaVietnamWest IndiesWestern AfricaWestern AsiaWestern EuropeYemenZaireZimbabweAzores
Unemployment Among Youth under 25 years
Income
Poverty
Unemployment
Labor Participation
Family Structure
Vehicle Availability
Education Level
Disability

Unemployment Among Youth under 25 years Comparison

Immigrants from Grenada

Immigrants from South Africa

Tragic
Exceptional
15.8%
UNEMPLOYMENT AMONG YOUTH UNDER 25 YEARS
0.0/ 100
METRIC RATING
332nd/ 347
METRIC RANK
11.2%
UNEMPLOYMENT AMONG YOUTH UNDER 25 YEARS
95.8/ 100
METRIC RATING
86th/ 347
METRIC RANK

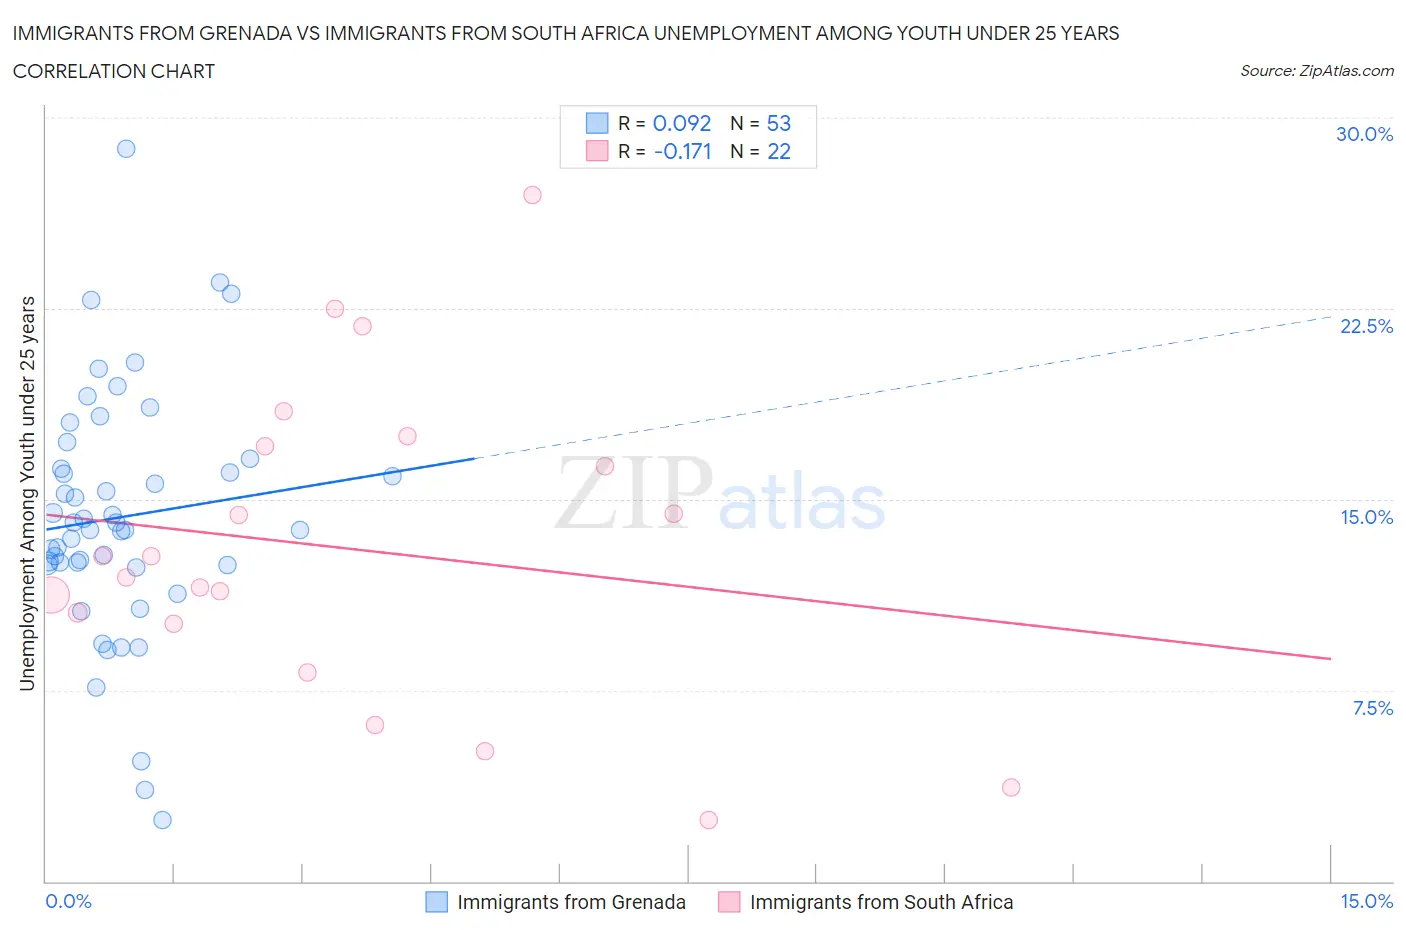
Immigrants from Grenada vs Immigrants from South Africa Unemployment Among Youth under 25 years Correlation Chart

The statistical analysis conducted on geographies consisting of 67,030,979 people shows a slight positive correlation between the proportion of Immigrants from Grenada and unemployment rate among youth under the age of 25 in the United States with a correlation coefficient (R) of 0.092 and weighted average of 15.8%. Similarly, the statistical analysis conducted on geographies consisting of 231,618,712 people shows a poor negative correlation between the proportion of Immigrants from South Africa and unemployment rate among youth under the age of 25 in the United States with a correlation coefficient (R) of -0.171 and weighted average of 11.2%, a difference of 40.9%.
Immigrants from Grenada vs Immigrants from South Africa Unemployment Among Youth under 25 years

Unemployment Among Youth under 25 years Correlation Summary

MeasurementImmigrants from GrenadaImmigrants from South Africa
Minimum2.4%2.4%
Maximum28.8%26.9%
Range26.4%24.5%
Mean14.3%13.1%
Median13.8%12.3%
Interquartile 25% (IQ1)12.4%10.1%
Interquartile 75% (IQ3)16.4%17.1%
Interquartile Range (IQR)4.0%6.9%
Standard Deviation (Sample)4.8%6.2%
Standard Deviation (Population)4.8%6.0%

Similar Demographics by Unemployment Among Youth under 25 years

Demographics Similar to Immigrants from Grenada by Unemployment Among Youth under 25 years

In terms of unemployment among youth under 25 years, the demographic groups most similar to Immigrants from Grenada are Guyanese (15.9%, a difference of 0.46%), Dominican (15.7%, a difference of 0.67%), Immigrants from Guyana (15.9%, a difference of 0.71%), Yakama (15.6%, a difference of 1.5%), and Immigrants from Yemen (15.6%, a difference of 1.5%).
DemographicsRating | RankUnemployment Among Youth under 25 years
Alaska Natives
0.0
/100
|
#325
Tragic
14.9%
Immigrants | Barbados
0.0
/100
|
#326
Tragic
15.2%
British West Indians
0.0
/100
|
#327
Tragic
15.5%
Immigrants | Dominican Republic
0.0
/100
|
#328
Tragic
15.6%
Immigrants | Yemen
0.0
/100
|
#329
Tragic
15.6%
Yakama
0.0
/100
|
#330
Tragic
15.6%
Dominicans
0.0
/100
|
#331
Tragic
15.7%
Immigrants | Grenada
0.0
/100
|
#332
Tragic
15.8%
Guyanese
0.0
/100
|
#333
Tragic
15.9%
Immigrants | Guyana
0.0
/100
|
#334
Tragic
15.9%
Immigrants | St. Vincent and the Grenadines
0.0
/100
|
#335
Tragic
16.1%
Pima
0.0
/100
|
#336
Tragic
16.2%
Arapaho
0.0
/100
|
#337
Tragic
16.3%
Yuman
0.0
/100
|
#338
Tragic
16.3%
Tsimshian
0.0
/100
|
#339
Tragic
16.5%

Demographics Similar to Immigrants from South Africa by Unemployment Among Youth under 25 years

In terms of unemployment among youth under 25 years, the demographic groups most similar to Immigrants from South Africa are Kenyan (11.2%, a difference of 0.010%), French Canadian (11.2%, a difference of 0.030%), Immigrants from South Central Asia (11.2%, a difference of 0.030%), Bolivian (11.2%, a difference of 0.070%), and Austrian (11.2%, a difference of 0.070%).
DemographicsRating | RankUnemployment Among Youth under 25 years
Immigrants | Canada
96.7
/100
|
#79
Exceptional
11.2%
Immigrants | Bulgaria
96.4
/100
|
#80
Exceptional
11.2%
Icelanders
96.3
/100
|
#81
Exceptional
11.2%
Northern Europeans
96.2
/100
|
#82
Exceptional
11.2%
Bolivians
96.1
/100
|
#83
Exceptional
11.2%
French Canadians
95.9
/100
|
#84
Exceptional
11.2%
Immigrants | South Central Asia
95.9
/100
|
#85
Exceptional
11.2%
Immigrants | South Africa
95.8
/100
|
#86
Exceptional
11.2%
Kenyans
95.7
/100
|
#87
Exceptional
11.2%
Austrians
95.5
/100
|
#88
Exceptional
11.2%
Immigrants | Japan
95.5
/100
|
#89
Exceptional
11.2%
Immigrants | Bolivia
95.5
/100
|
#90
Exceptional
11.2%
Immigrants | Taiwan
95.1
/100
|
#91
Exceptional
11.2%
Immigrants | Latvia
95.1
/100
|
#92
Exceptional
11.2%
Immigrants | North America
95.1
/100
|
#93
Exceptional
11.2%