Immigrants from Grenada vs Immigrants from Nigeria Unemployment Among Ages 25 to 29 years

COMPARE

Immigrants from Grenada
Race
Ancestry
AfghanAfricanAlaska NativeAlaskan AthabascanAlbanianAleutAlsatianAmericanApacheArabArapahoArgentineanArmenianAssyrian/Chaldean/SyriacAustralianAustrianBahamianBangladeshiBarbadianBasqueBelgianBelizeanBermudanBhutaneseBlackfeetBolivianBrazilianBritishBritish West IndianBulgarianBurmeseCajunCambodianCanadianCape VerdeanCarpatho RusynCelticCentral AmericanCentral American IndianCherokeeCheyenneChickasawChileanChineseChippewaChoctawColombianColvilleComancheCosta RicanCreeCreekCroatianCrowCubanCypriotCzechCzechoslovakianDanishDelawareDominicanDutchDutch West IndianEastern EuropeanEcuadorianEgyptianEnglishEstonianEthiopianEuropeanFijianFilipinoFinnishFrenchFrench American IndianFrench CanadianGermanGerman RussianGhanaianGreekGuamanian/ChamorroGuatemalanGuyaneseHaitianHmongHonduranHopiHoumaHungarianIcelanderIndian (Asian)IndonesianInupiatIranianIraqiIrishIroquoisIsraeliItalianJamaicanJapaneseJordanianKenyanKiowaKoreanLaotianLatvianLebaneseLiberianLithuanianLumbeeLuxembourgerMacedonianMalaysianMalteseMarshalleseMenomineeMexicanMexican American IndianMongolianMoroccanNative HawaiianNavajoNepaleseNew ZealanderNicaraguanNigerianNorthern EuropeanNorwegianOkinawanOsageOttawaPaiutePakistaniPalestinianPanamanianParaguayanPennsylvania GermanPeruvianPimaPolishPortuguesePotawatomiPuebloPuerto RicanPuget Sound SalishRomanianRussianSalvadoranSamoanScandinavianScotch-IrishScottishSeminoleSenegaleseSerbianShoshoneSierra LeoneanSiouxSlavicSlovakSloveneSomaliSouth AfricanSouth AmericanSouth American IndianSoviet UnionSpaniardSpanishSpanish AmericanSpanish American IndianSri LankanSubsaharan AfricanSudaneseSwedishSwissSyrianTaiwaneseThaiTlingit-HaidaTohono O'OdhamTonganTrinidadian and TobagonianTsimshianTurkishU.S. Virgin IslanderUgandanUkrainianUruguayanUteVenezuelanVietnameseWelshWest IndianYakamaYaquiYugoslavianYumanYup'ikZimbabwean
Immigration
NonimmigrantsImmigrantsAfghanistanAfricaAlbaniaArgentinaArmeniaAsiaAustraliaAustriaBahamasBangladeshBarbadosBelarusBelgiumBelizeBoliviaBosnia and HerzegovinaBrazilBulgariaBurma/MyanmarCabo VerdeCambodiaCameroonCanadaCaribbeanCentral AmericaChileChinaColombiaCongoCosta RicaCroatiaCubaCzechoslovakiaDenmarkDominicaDominican RepublicEastern AfricaEastern AsiaEastern EuropeEcuadorEgyptEl SalvadorEnglandEritreaEthiopiaEuropeFijiFranceGermanyGhanaGreeceGrenadaGuatemalaGuyanaHaitiHondurasHong KongHungaryIndiaIndonesiaIranIraqIrelandIsraelItalyJamaicaJapanJordanKazakhstanKenyaKoreaKuwaitLaosLatin AmericaLatviaLebanonLiberiaLithuaniaMalaysiaMexicoMicronesiaMiddle AfricaMoldovaMoroccoNepalNetherlandsNicaraguaNorth AmericaNorth MacedoniaNorthern AfricaNorthern EuropeNorwayOceaniaPakistanPanamaPeruPhilippinesPolandPortugalRomaniaRussiaSaudi ArabiaScotlandSenegalSerbiaSierra LeoneSingaporeSomaliaSouth AfricaSouth AmericaSouth Central AsiaSouth Eastern AsiaSouthern EuropeSpainSri LankaSt. Vincent and the GrenadinesSudanSwedenSwitzerlandSyriaTaiwanThailandTrinidad and TobagoTurkeyUgandaUkraineUruguayUzbekistanVenezuelaVietnamWest IndiesWestern AfricaWestern AsiaWestern EuropeYemenZaireZimbabweAzores
Immigrants from Nigeria
Race
Ancestry
AfghanAfricanAlaska NativeAlaskan AthabascanAlbanianAleutAlsatianAmericanApacheArabArapahoArgentineanArmenianAssyrian/Chaldean/SyriacAustralianAustrianBahamianBangladeshiBarbadianBasqueBelgianBelizeanBermudanBhutaneseBlackfeetBolivianBrazilianBritishBritish West IndianBulgarianBurmeseCajunCambodianCanadianCape VerdeanCarpatho RusynCelticCentral AmericanCentral American IndianCherokeeCheyenneChickasawChileanChineseChippewaChoctawColombianColvilleComancheCosta RicanCreeCreekCroatianCrowCubanCypriotCzechCzechoslovakianDanishDelawareDominicanDutchDutch West IndianEastern EuropeanEcuadorianEgyptianEnglishEstonianEthiopianEuropeanFijianFilipinoFinnishFrenchFrench American IndianFrench CanadianGermanGerman RussianGhanaianGreekGuamanian/ChamorroGuatemalanGuyaneseHaitianHmongHonduranHopiHoumaHungarianIcelanderIndian (Asian)IndonesianInupiatIranianIraqiIrishIroquoisIsraeliItalianJamaicanJapaneseJordanianKenyanKiowaKoreanLaotianLatvianLebaneseLiberianLithuanianLumbeeLuxembourgerMacedonianMalaysianMalteseMarshalleseMenomineeMexicanMexican American IndianMongolianMoroccanNative HawaiianNavajoNepaleseNew ZealanderNicaraguanNigerianNorthern EuropeanNorwegianOkinawanOsageOttawaPaiutePakistaniPalestinianPanamanianParaguayanPennsylvania GermanPeruvianPimaPolishPortuguesePotawatomiPuebloPuerto RicanPuget Sound SalishRomanianRussianSalvadoranSamoanScandinavianScotch-IrishScottishSeminoleSenegaleseSerbianShoshoneSierra LeoneanSiouxSlavicSlovakSloveneSomaliSouth AfricanSouth AmericanSouth American IndianSoviet UnionSpaniardSpanishSpanish AmericanSpanish American IndianSri LankanSubsaharan AfricanSudaneseSwedishSwissSyrianTaiwaneseThaiTlingit-HaidaTohono O'OdhamTonganTrinidadian and TobagonianTsimshianTurkishU.S. Virgin IslanderUgandanUkrainianUruguayanUteVenezuelanVietnameseWelshWest IndianYakamaYaquiYugoslavianYumanYup'ikZimbabwean
Immigration
NonimmigrantsImmigrantsAfghanistanAfricaAlbaniaArgentinaArmeniaAsiaAustraliaAustriaBahamasBangladeshBarbadosBelarusBelgiumBelizeBoliviaBosnia and HerzegovinaBrazilBulgariaBurma/MyanmarCabo VerdeCambodiaCameroonCanadaCaribbeanCentral AmericaChileChinaColombiaCongoCosta RicaCroatiaCubaCzechoslovakiaDenmarkDominicaDominican RepublicEastern AfricaEastern AsiaEastern EuropeEcuadorEgyptEl SalvadorEnglandEritreaEthiopiaEuropeFijiFranceGermanyGhanaGreeceGuatemalaGuyanaHaitiHondurasHong KongHungaryIndiaIndonesiaIranIraqIrelandIsraelItalyJamaicaJapanJordanKazakhstanKenyaKoreaKuwaitLaosLatin AmericaLatviaLebanonLiberiaLithuaniaMalaysiaMexicoMicronesiaMiddle AfricaMoldovaMoroccoNepalNetherlandsNicaraguaNigeriaNorth AmericaNorth MacedoniaNorthern AfricaNorthern EuropeNorwayOceaniaPakistanPanamaPeruPhilippinesPolandPortugalRomaniaRussiaSaudi ArabiaScotlandSenegalSerbiaSierra LeoneSingaporeSomaliaSouth AfricaSouth AmericaSouth Central AsiaSouth Eastern AsiaSouthern EuropeSpainSri LankaSt. Vincent and the GrenadinesSudanSwedenSwitzerlandSyriaTaiwanThailandTrinidad and TobagoTurkeyUgandaUkraineUruguayUzbekistanVenezuelaVietnamWest IndiesWestern AfricaWestern AsiaWestern EuropeYemenZaireZimbabweAzores
Unemployment Among Ages 25 to 29 years
Income
Poverty
Unemployment
Labor Participation
Family Structure
Vehicle Availability
Education Level
Disability

Unemployment Among Ages 25 to 29 years Comparison

Immigrants from Grenada

Immigrants from Nigeria

Tragic
Tragic
8.4%
UNEMPLOYMENT AMONG AGES 25 TO 29 YEARS
0.0/ 100
METRIC RATING
316th/ 347
METRIC RANK
7.5%
UNEMPLOYMENT AMONG AGES 25 TO 29 YEARS
0.0/ 100
METRIC RATING
273rd/ 347
METRIC RANK

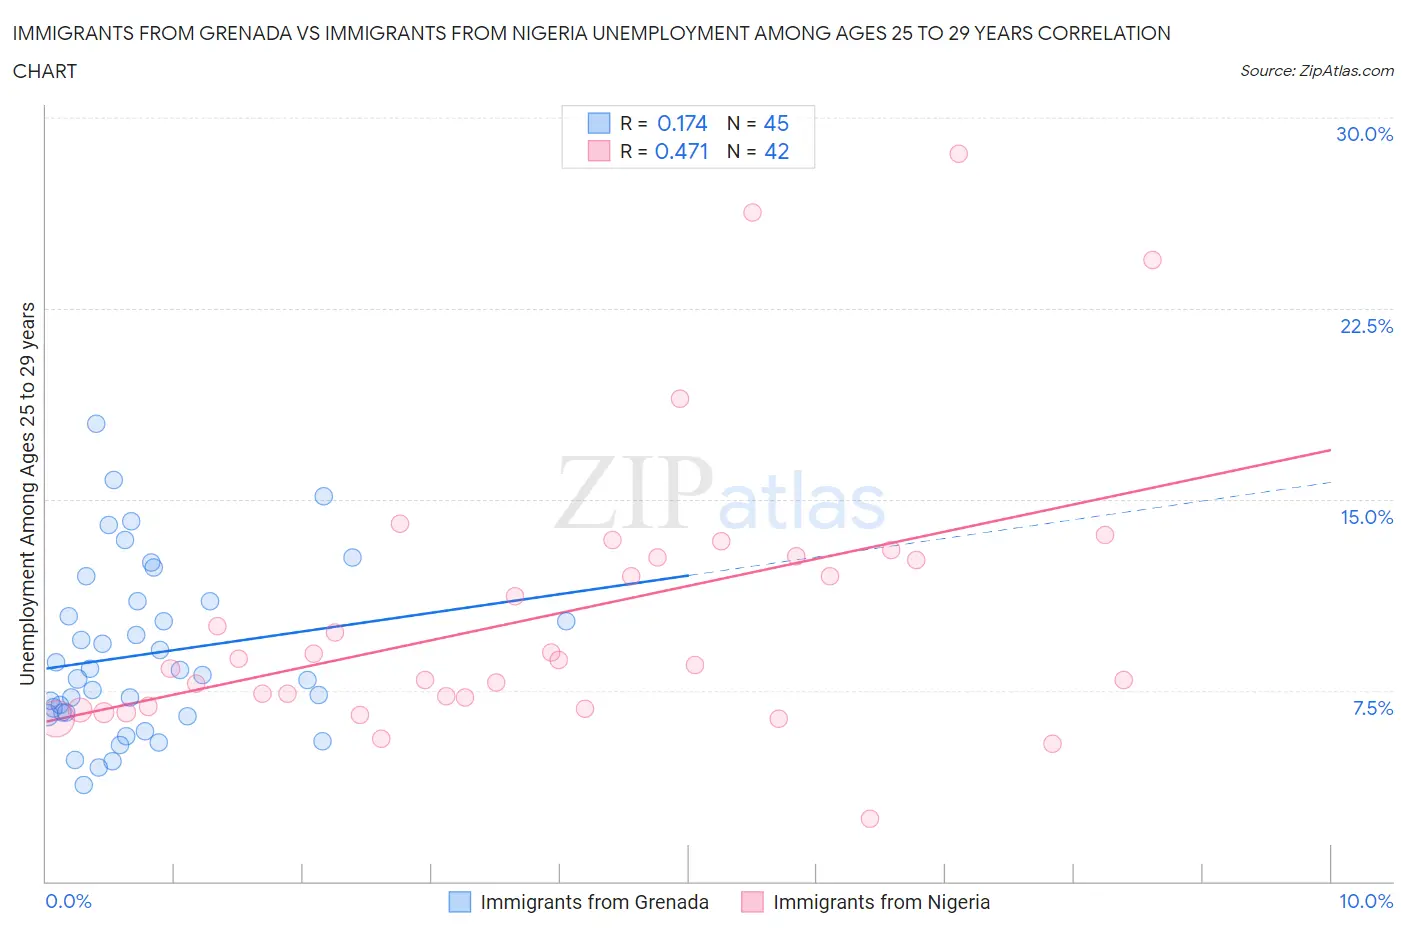
Immigrants from Grenada vs Immigrants from Nigeria Unemployment Among Ages 25 to 29 years Correlation Chart

The statistical analysis conducted on geographies consisting of 66,445,528 people shows a poor positive correlation between the proportion of Immigrants from Grenada and unemployment rate among population between the ages 25 and 29 in the United States with a correlation coefficient (R) of 0.174 and weighted average of 8.4%. Similarly, the statistical analysis conducted on geographies consisting of 276,693,961 people shows a moderate positive correlation between the proportion of Immigrants from Nigeria and unemployment rate among population between the ages 25 and 29 in the United States with a correlation coefficient (R) of 0.471 and weighted average of 7.5%, a difference of 13.2%.
Immigrants from Grenada vs Immigrants from Nigeria Unemployment Among Ages 25 to 29 years

Unemployment Among Ages 25 to 29 years Correlation Summary

MeasurementImmigrants from GrenadaImmigrants from Nigeria
Minimum3.8%2.4%
Maximum18.0%28.6%
Range14.2%26.2%
Mean8.9%10.4%
Median8.1%8.6%
Interquartile 25% (IQ1)6.6%6.9%
Interquartile 75% (IQ3)11.0%12.7%
Interquartile Range (IQR)4.4%5.9%
Standard Deviation (Sample)3.3%5.5%
Standard Deviation (Population)3.3%5.4%

Similar Demographics by Unemployment Among Ages 25 to 29 years

Demographics Similar to Immigrants from Grenada by Unemployment Among Ages 25 to 29 years

In terms of unemployment among ages 25 to 29 years, the demographic groups most similar to Immigrants from Grenada are British West Indian (8.4%, a difference of 0.070%), Immigrants from Guyana (8.5%, a difference of 0.090%), Guyanese (8.5%, a difference of 0.35%), Immigrants from Armenia (8.5%, a difference of 0.57%), and Immigrants from Dominica (8.4%, a difference of 0.66%).
DemographicsRating | RankUnemployment Among Ages 25 to 29 years
Immigrants | Haiti
0.0
/100
|
#309
Tragic
8.1%
U.S. Virgin Islanders
0.0
/100
|
#310
Tragic
8.1%
Immigrants | Azores
0.0
/100
|
#311
Tragic
8.1%
Dutch West Indians
0.0
/100
|
#312
Tragic
8.2%
Immigrants | St. Vincent and the Grenadines
0.0
/100
|
#313
Tragic
8.4%
Immigrants | Dominica
0.0
/100
|
#314
Tragic
8.4%
British West Indians
0.0
/100
|
#315
Tragic
8.4%
Immigrants | Grenada
0.0
/100
|
#316
Tragic
8.4%
Immigrants | Guyana
0.0
/100
|
#317
Tragic
8.5%
Guyanese
0.0
/100
|
#318
Tragic
8.5%
Immigrants | Armenia
0.0
/100
|
#319
Tragic
8.5%
Blacks/African Americans
0.0
/100
|
#320
Tragic
8.6%
Immigrants | Dominican Republic
0.0
/100
|
#321
Tragic
8.6%
Tlingit-Haida
0.0
/100
|
#322
Tragic
8.7%
Dominicans
0.0
/100
|
#323
Tragic
8.7%

Demographics Similar to Immigrants from Nigeria by Unemployment Among Ages 25 to 29 years

In terms of unemployment among ages 25 to 29 years, the demographic groups most similar to Immigrants from Nigeria are Immigrants from Bahamas (7.5%, a difference of 0.020%), Choctaw (7.5%, a difference of 0.080%), Bahamian (7.5%, a difference of 0.10%), Immigrants from Central America (7.5%, a difference of 0.21%), and Immigrants from Ghana (7.5%, a difference of 0.29%).
DemographicsRating | RankUnemployment Among Ages 25 to 29 years
Paiute
0.1
/100
|
#266
Tragic
7.4%
Pennsylvania Germans
0.1
/100
|
#267
Tragic
7.4%
Immigrants | Ecuador
0.1
/100
|
#268
Tragic
7.4%
Immigrants | Latin America
0.1
/100
|
#269
Tragic
7.4%
Bahamians
0.0
/100
|
#270
Tragic
7.5%
Choctaw
0.0
/100
|
#271
Tragic
7.5%
Immigrants | Bahamas
0.0
/100
|
#272
Tragic
7.5%
Immigrants | Nigeria
0.0
/100
|
#273
Tragic
7.5%
Immigrants | Central America
0.0
/100
|
#274
Tragic
7.5%
Immigrants | Ghana
0.0
/100
|
#275
Tragic
7.5%
French American Indians
0.0
/100
|
#276
Tragic
7.5%
Iroquois
0.0
/100
|
#277
Tragic
7.5%
Mexicans
0.0
/100
|
#278
Tragic
7.5%
Nepalese
0.0
/100
|
#279
Tragic
7.5%
Immigrants | Caribbean
0.0
/100
|
#280
Tragic
7.5%