Immigrants from Ghana vs West Indian Female Unemployment
COMPARE
Immigrants from Ghana
West Indian
Female Unemployment
Female Unemployment Comparison
Immigrants from Ghana
West Indians
6.0%
FEMALE UNEMPLOYMENT
0.0/ 100
METRIC RATING
277th/ 347
METRIC RANK
6.1%
FEMALE UNEMPLOYMENT
0.0/ 100
METRIC RATING
297th/ 347
METRIC RANK
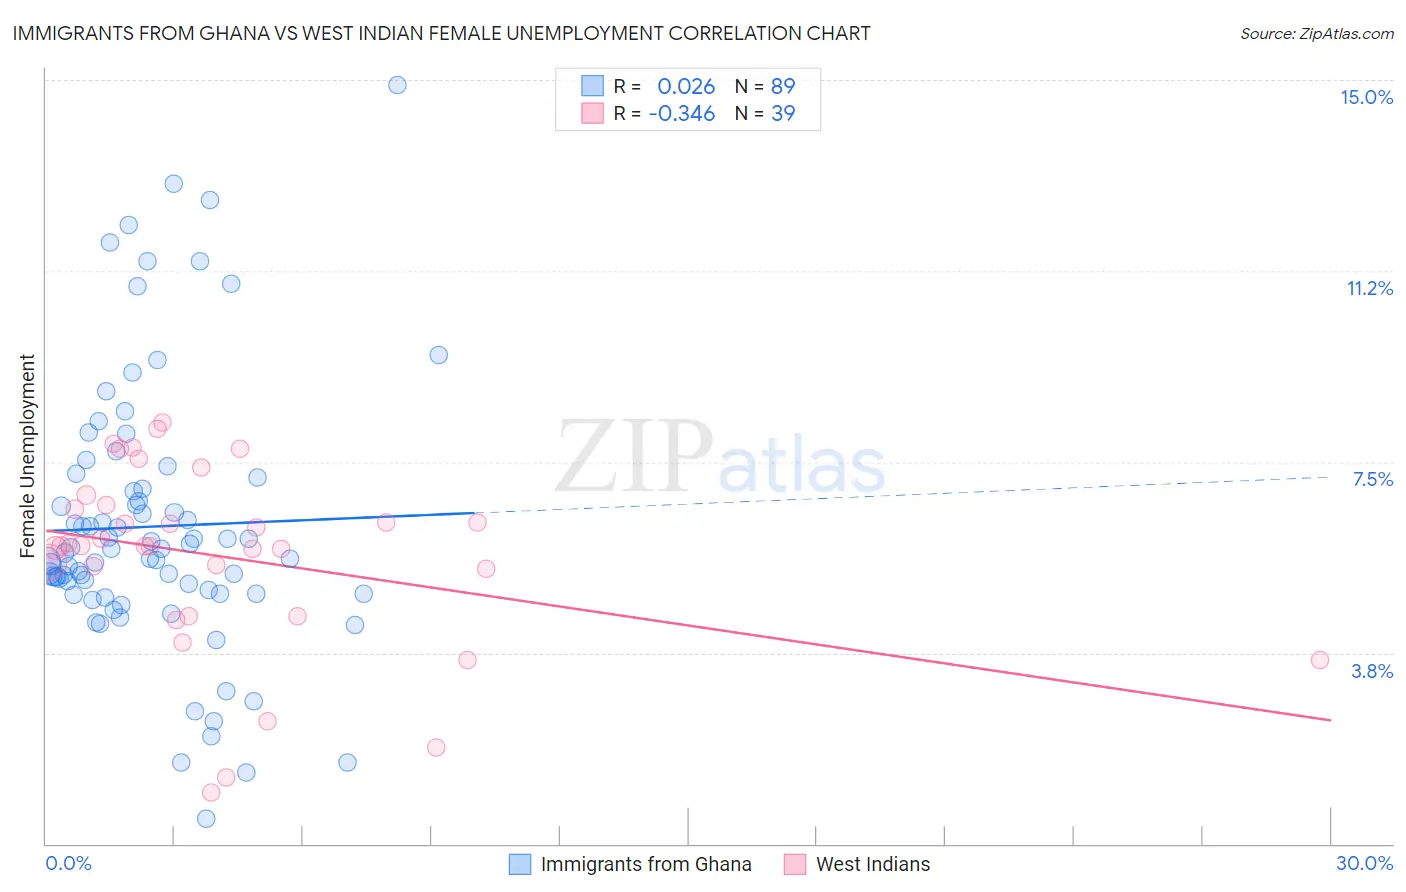
Immigrants from Ghana vs West Indian Female Unemployment Correlation Chart
The statistical analysis conducted on geographies consisting of 199,631,349 people shows no correlation between the proportion of Immigrants from Ghana and unemploymnet rate among females in the United States with a correlation coefficient (R) of 0.026 and weighted average of 6.0%. Similarly, the statistical analysis conducted on geographies consisting of 253,607,291 people shows a mild negative correlation between the proportion of West Indians and unemploymnet rate among females in the United States with a correlation coefficient (R) of -0.346 and weighted average of 6.1%, a difference of 2.0%.
Female Unemployment Correlation Summary
| Measurement | Immigrants from Ghana | West Indian |
| Minimum | 0.50% | 1.0% |
| Maximum | 14.9% | 8.3% |
| Range | 14.4% | 7.3% |
| Mean | 6.2% | 5.6% |
| Median | 5.7% | 5.9% |
| Interquartile 25% (IQ1) | 4.9% | 4.5% |
| Interquartile 75% (IQ3) | 7.1% | 6.7% |
| Interquartile Range (IQR) | 2.2% | 2.2% |
| Standard Deviation (Sample) | 2.6% | 1.8% |
| Standard Deviation (Population) | 2.6% | 1.8% |
Demographics Similar to Immigrants from Ghana and West Indians by Female Unemployment
In terms of female unemployment, the demographic groups most similar to Immigrants from Ghana are Yaqui (6.0%, a difference of 0.0%), Armenian (6.0%, a difference of 0.12%), Mexican American Indian (6.0%, a difference of 0.17%), Guatemalan (6.0%, a difference of 0.21%), and Colville (6.0%, a difference of 0.48%). Similarly, the demographic groups most similar to West Indians are Alaskan Athabascan (6.1%, a difference of 0.010%), Immigrants from Latin America (6.1%, a difference of 0.030%), Immigrants from El Salvador (6.1%, a difference of 0.13%), Mexican (6.1%, a difference of 0.23%), and Immigrants from Trinidad and Tobago (6.1%, a difference of 0.31%).
| Demographics | Rating | Rank | Female Unemployment |
| Immigrants | Ghana | 0.0 /100 | #277 | Tragic 6.0% |
| Yaqui | 0.0 /100 | #278 | Tragic 6.0% |
| Armenians | 0.0 /100 | #279 | Tragic 6.0% |
| Mexican American Indians | 0.0 /100 | #280 | Tragic 6.0% |
| Guatemalans | 0.0 /100 | #281 | Tragic 6.0% |
| Colville | 0.0 /100 | #282 | Tragic 6.0% |
| Salvadorans | 0.0 /100 | #283 | Tragic 6.0% |
| Immigrants | Senegal | 0.0 /100 | #284 | Tragic 6.1% |
| Immigrants | Cabo Verde | 0.0 /100 | #285 | Tragic 6.1% |
| Chippewa | 0.0 /100 | #286 | Tragic 6.1% |
| Immigrants | Guatemala | 0.0 /100 | #287 | Tragic 6.1% |
| Haitians | 0.0 /100 | #288 | Tragic 6.1% |
| Trinidadians and Tobagonians | 0.0 /100 | #289 | Tragic 6.1% |
| Immigrants | Caribbean | 0.0 /100 | #290 | Tragic 6.1% |
| Immigrants | West Indies | 0.0 /100 | #291 | Tragic 6.1% |
| Immigrants | Trinidad and Tobago | 0.0 /100 | #292 | Tragic 6.1% |
| Mexicans | 0.0 /100 | #293 | Tragic 6.1% |
| Immigrants | El Salvador | 0.0 /100 | #294 | Tragic 6.1% |
| Immigrants | Latin America | 0.0 /100 | #295 | Tragic 6.1% |
| Alaskan Athabascans | 0.0 /100 | #296 | Tragic 6.1% |
| West Indians | 0.0 /100 | #297 | Tragic 6.1% |