Immigrants from Fiji vs Immigrants from Malaysia Unemployment Among Ages 65 to 74 years
COMPARE
Immigrants from Fiji
Immigrants from Malaysia
Unemployment Among Ages 65 to 74 years
Unemployment Among Ages 65 to 74 years Comparison
Immigrants from Fiji
Immigrants from Malaysia
5.3%
UNEMPLOYMENT AMONG AGES 65 TO 74 YEARS
89.9/ 100
METRIC RATING
119th/ 347
METRIC RANK
5.2%
UNEMPLOYMENT AMONG AGES 65 TO 74 YEARS
94.1/ 100
METRIC RATING
108th/ 347
METRIC RANK
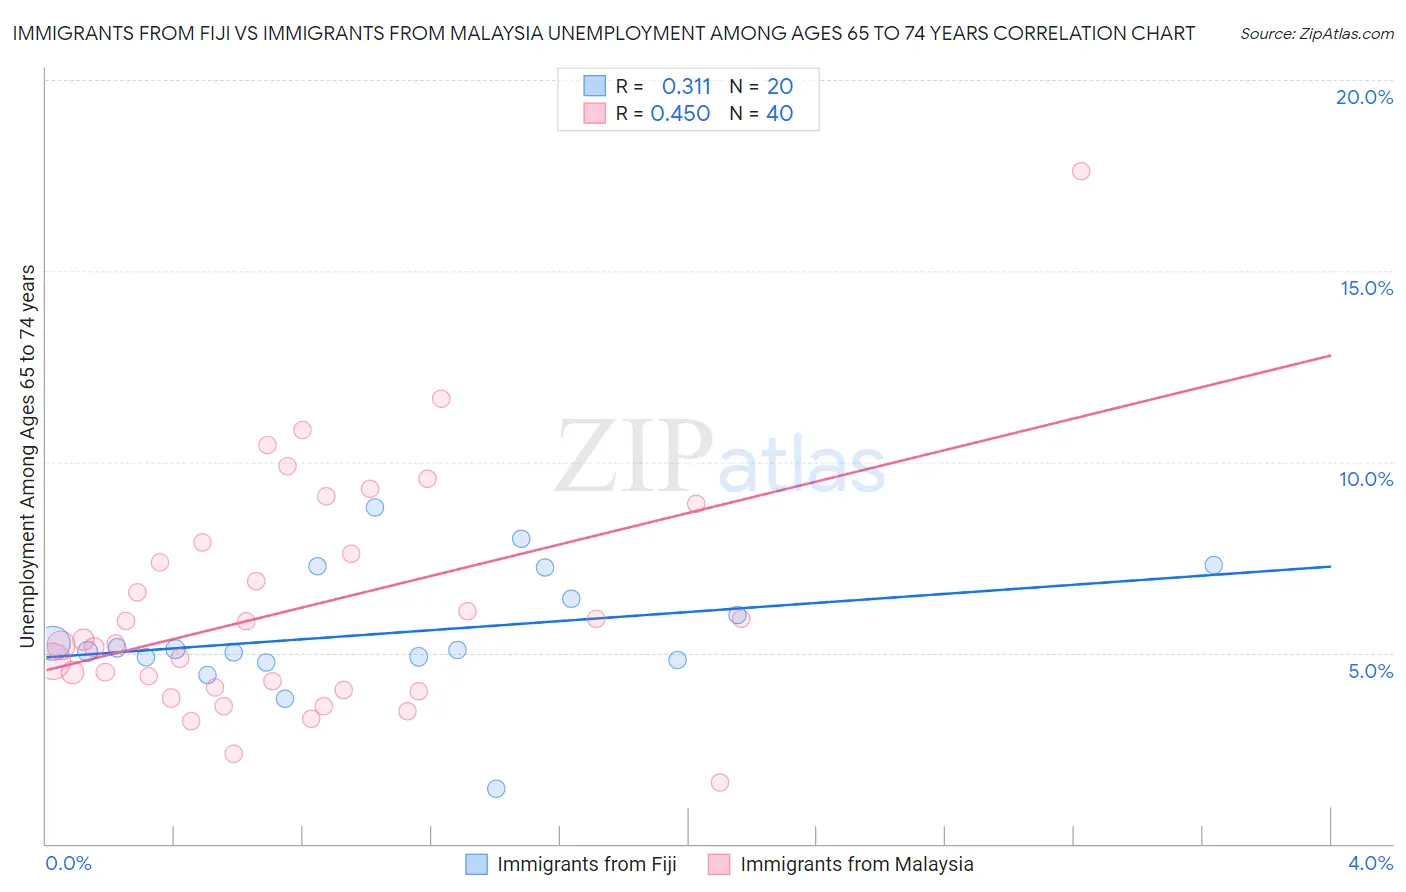
Immigrants from Fiji vs Immigrants from Malaysia Unemployment Among Ages 65 to 74 years Correlation Chart
The statistical analysis conducted on geographies consisting of 90,875,460 people shows a mild positive correlation between the proportion of Immigrants from Fiji and unemployment rate among population between the ages 65 and 74 in the United States with a correlation coefficient (R) of 0.311 and weighted average of 5.3%. Similarly, the statistical analysis conducted on geographies consisting of 186,477,292 people shows a moderate positive correlation between the proportion of Immigrants from Malaysia and unemployment rate among population between the ages 65 and 74 in the United States with a correlation coefficient (R) of 0.450 and weighted average of 5.2%, a difference of 0.49%.
Unemployment Among Ages 65 to 74 years Correlation Summary
| Measurement | Immigrants from Fiji | Immigrants from Malaysia |
| Minimum | 1.4% | 1.6% |
| Maximum | 8.8% | 17.6% |
| Range | 7.4% | 16.0% |
| Mean | 5.5% | 6.2% |
| Median | 5.1% | 5.3% |
| Interquartile 25% (IQ1) | 4.8% | 4.0% |
| Interquartile 75% (IQ3) | 6.8% | 7.7% |
| Interquartile Range (IQR) | 2.0% | 3.7% |
| Standard Deviation (Sample) | 1.6% | 3.1% |
| Standard Deviation (Population) | 1.6% | 3.0% |
Demographics Similar to Immigrants from Fiji and Immigrants from Malaysia by Unemployment Among Ages 65 to 74 years
In terms of unemployment among ages 65 to 74 years, the demographic groups most similar to Immigrants from Fiji are Immigrants from Switzerland (5.3%, a difference of 0.0%), Immigrants from Belarus (5.3%, a difference of 0.010%), Immigrants from Korea (5.3%, a difference of 0.030%), Australian (5.3%, a difference of 0.050%), and Immigrants from Australia (5.3%, a difference of 0.070%). Similarly, the demographic groups most similar to Immigrants from Malaysia are Immigrants from Singapore (5.2%, a difference of 0.030%), Austrian (5.2%, a difference of 0.060%), Immigrants from Bolivia (5.2%, a difference of 0.080%), Malaysian (5.2%, a difference of 0.18%), and Iranian (5.2%, a difference of 0.19%).
| Demographics | Rating | Rank | Unemployment Among Ages 65 to 74 years |
| Immigrants | Vietnam | 95.6 /100 | #103 | Exceptional 5.2% |
| Yugoslavians | 95.5 /100 | #104 | Exceptional 5.2% |
| Iranians | 95.2 /100 | #105 | Exceptional 5.2% |
| Malaysians | 95.1 /100 | #106 | Exceptional 5.2% |
| Austrians | 94.5 /100 | #107 | Exceptional 5.2% |
| Immigrants | Malaysia | 94.1 /100 | #108 | Exceptional 5.2% |
| Immigrants | Singapore | 93.9 /100 | #109 | Exceptional 5.2% |
| Immigrants | Bolivia | 93.6 /100 | #110 | Exceptional 5.2% |
| Sri Lankans | 92.7 /100 | #111 | Exceptional 5.3% |
| Immigrants | South Central Asia | 92.4 /100 | #112 | Exceptional 5.3% |
| Immigrants | Germany | 91.6 /100 | #113 | Exceptional 5.3% |
| Asians | 91.1 /100 | #114 | Exceptional 5.3% |
| Immigrants | Turkey | 90.8 /100 | #115 | Exceptional 5.3% |
| Australians | 90.4 /100 | #116 | Exceptional 5.3% |
| Immigrants | Korea | 90.2 /100 | #117 | Exceptional 5.3% |
| Immigrants | Belarus | 90.1 /100 | #118 | Exceptional 5.3% |
| Immigrants | Fiji | 89.9 /100 | #119 | Excellent 5.3% |
| Immigrants | Switzerland | 89.9 /100 | #120 | Excellent 5.3% |
| Immigrants | Australia | 89.1 /100 | #121 | Excellent 5.3% |
| Immigrants | Canada | 89.0 /100 | #122 | Excellent 5.3% |
| Czechoslovakians | 88.6 /100 | #123 | Excellent 5.3% |