Immigrants from Europe vs Immigrants from Yemen Unemployment Among Ages 16 to 19 years
COMPARE
Immigrants from Europe
Immigrants from Yemen
Unemployment Among Ages 16 to 19 years
Unemployment Among Ages 16 to 19 years Comparison
Immigrants from Europe
Immigrants from Yemen
17.6%
UNEMPLOYMENT AMONG AGES 16 TO 19 YEARS
41.8/ 100
METRIC RATING
189th/ 347
METRIC RANK
20.0%
UNEMPLOYMENT AMONG AGES 16 TO 19 YEARS
0.0/ 100
METRIC RATING
291st/ 347
METRIC RANK
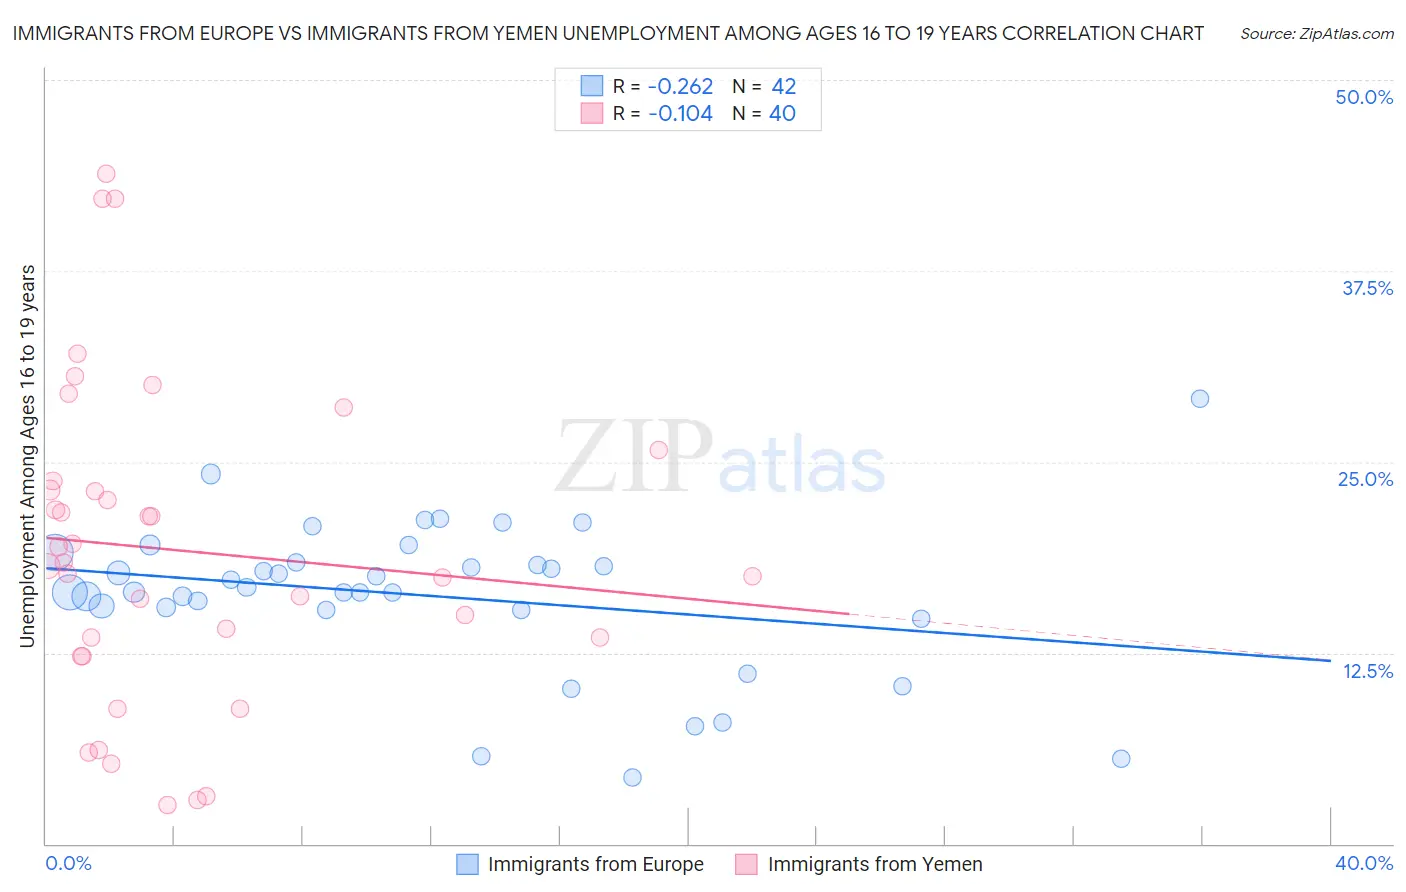
Immigrants from Europe vs Immigrants from Yemen Unemployment Among Ages 16 to 19 years Correlation Chart
The statistical analysis conducted on geographies consisting of 496,023,706 people shows a weak negative correlation between the proportion of Immigrants from Europe and unemployment rate among population between the ages 16 and 19 in the United States with a correlation coefficient (R) of -0.262 and weighted average of 17.6%. Similarly, the statistical analysis conducted on geographies consisting of 81,680,406 people shows a poor negative correlation between the proportion of Immigrants from Yemen and unemployment rate among population between the ages 16 and 19 in the United States with a correlation coefficient (R) of -0.104 and weighted average of 20.0%, a difference of 13.6%.
Unemployment Among Ages 16 to 19 years Correlation Summary
| Measurement | Immigrants from Europe | Immigrants from Yemen |
| Minimum | 4.3% | 2.5% |
| Maximum | 29.1% | 43.9% |
| Range | 24.8% | 41.4% |
| Mean | 16.2% | 19.2% |
| Median | 16.6% | 18.3% |
| Interquartile 25% (IQ1) | 15.3% | 12.9% |
| Interquartile 75% (IQ3) | 18.4% | 23.5% |
| Interquartile Range (IQR) | 3.1% | 10.6% |
| Standard Deviation (Sample) | 5.0% | 10.4% |
| Standard Deviation (Population) | 4.9% | 10.2% |
Similar Demographics by Unemployment Among Ages 16 to 19 years
Demographics Similar to Immigrants from Europe by Unemployment Among Ages 16 to 19 years
In terms of unemployment among ages 16 to 19 years, the demographic groups most similar to Immigrants from Europe are Marshallese (17.6%, a difference of 0.010%), Immigrants from Nicaragua (17.6%, a difference of 0.020%), Immigrants from Micronesia (17.6%, a difference of 0.030%), Immigrants from Costa Rica (17.6%, a difference of 0.030%), and Japanese (17.6%, a difference of 0.060%).
| Demographics | Rating | Rank | Unemployment Among Ages 16 to 19 years |
| Russians | 45.2 /100 | #182 | Average 17.6% |
| Immigrants | Uruguay | 44.6 /100 | #183 | Average 17.6% |
| Eastern Europeans | 44.3 /100 | #184 | Average 17.6% |
| Iroquois | 43.4 /100 | #185 | Average 17.6% |
| Japanese | 43.2 /100 | #186 | Average 17.6% |
| Immigrants | Micronesia | 42.4 /100 | #187 | Average 17.6% |
| Immigrants | Nicaragua | 42.2 /100 | #188 | Average 17.6% |
| Immigrants | Europe | 41.8 /100 | #189 | Average 17.6% |
| Marshallese | 41.7 /100 | #190 | Average 17.6% |
| Immigrants | Costa Rica | 41.3 /100 | #191 | Average 17.6% |
| Immigrants | Philippines | 40.7 /100 | #192 | Average 17.7% |
| Immigrants | Australia | 40.6 /100 | #193 | Average 17.7% |
| Peruvians | 38.8 /100 | #194 | Fair 17.7% |
| Immigrants | Peru | 37.3 /100 | #195 | Fair 17.7% |
| Alaskan Athabascans | 34.1 /100 | #196 | Fair 17.7% |
Demographics Similar to Immigrants from Yemen by Unemployment Among Ages 16 to 19 years
In terms of unemployment among ages 16 to 19 years, the demographic groups most similar to Immigrants from Yemen are Immigrants from Sierra Leone (20.0%, a difference of 0.43%), Pueblo (19.8%, a difference of 0.96%), Comanche (20.2%, a difference of 1.0%), Immigrants from the Azores (19.8%, a difference of 1.1%), and Immigrants from Ghana (19.8%, a difference of 1.3%).
| Demographics | Rating | Rank | Unemployment Among Ages 16 to 19 years |
| Sierra Leoneans | 0.0 /100 | #284 | Tragic 19.7% |
| Ghanaians | 0.0 /100 | #285 | Tragic 19.8% |
| Bahamians | 0.0 /100 | #286 | Tragic 19.8% |
| Immigrants | Ghana | 0.0 /100 | #287 | Tragic 19.8% |
| Immigrants | Azores | 0.0 /100 | #288 | Tragic 19.8% |
| Pueblo | 0.0 /100 | #289 | Tragic 19.8% |
| Immigrants | Sierra Leone | 0.0 /100 | #290 | Tragic 20.0% |
| Immigrants | Yemen | 0.0 /100 | #291 | Tragic 20.0% |
| Comanche | 0.0 /100 | #292 | Tragic 20.2% |
| Immigrants | Bahamas | 0.0 /100 | #293 | Tragic 20.4% |
| Immigrants | Haiti | 0.0 /100 | #294 | Tragic 20.4% |
| Central American Indians | 0.0 /100 | #295 | Tragic 20.4% |
| Armenians | 0.0 /100 | #296 | Tragic 20.5% |
| Alsatians | 0.0 /100 | #297 | Tragic 20.5% |
| Haitians | 0.0 /100 | #298 | Tragic 20.5% |