Immigrants from Ethiopia vs Immigrants from Ghana Unemployment Among Seniors over 65 years

COMPARE

Immigrants from Ethiopia
Race
Ancestry
AfghanAfricanAlaska NativeAlaskan AthabascanAlbanianAleutAlsatianAmericanApacheArabArapahoArgentineanArmenianAssyrian/Chaldean/SyriacAustralianAustrianBahamianBangladeshiBarbadianBasqueBelgianBelizeanBermudanBhutaneseBlackfeetBolivianBrazilianBritishBritish West IndianBulgarianBurmeseCajunCambodianCanadianCape VerdeanCarpatho RusynCelticCentral AmericanCentral American IndianCherokeeCheyenneChickasawChileanChineseChippewaChoctawColombianColvilleComancheCosta RicanCreeCreekCroatianCrowCubanCypriotCzechCzechoslovakianDanishDelawareDominicanDutchDutch West IndianEastern EuropeanEcuadorianEgyptianEnglishEstonianEthiopianEuropeanFijianFilipinoFinnishFrenchFrench American IndianFrench CanadianGermanGerman RussianGhanaianGreekGuamanian/ChamorroGuatemalanGuyaneseHaitianHmongHonduranHopiHoumaHungarianIcelanderIndian (Asian)IndonesianInupiatIranianIraqiIrishIroquoisIsraeliItalianJamaicanJapaneseJordanianKenyanKiowaKoreanLaotianLatvianLebaneseLiberianLithuanianLumbeeLuxembourgerMacedonianMalaysianMalteseMarshalleseMenomineeMexicanMexican American IndianMongolianMoroccanNative HawaiianNavajoNepaleseNew ZealanderNicaraguanNigerianNorthern EuropeanNorwegianOkinawanOsageOttawaPaiutePakistaniPalestinianPanamanianParaguayanPennsylvania GermanPeruvianPimaPolishPortuguesePotawatomiPuebloPuerto RicanPuget Sound SalishRomanianRussianSalvadoranSamoanScandinavianScotch-IrishScottishSeminoleSenegaleseSerbianShoshoneSierra LeoneanSiouxSlavicSlovakSloveneSomaliSouth AfricanSouth AmericanSouth American IndianSoviet UnionSpaniardSpanishSpanish AmericanSpanish American IndianSri LankanSubsaharan AfricanSudaneseSwedishSwissSyrianTaiwaneseThaiTlingit-HaidaTohono O'OdhamTonganTrinidadian and TobagonianTsimshianTurkishU.S. Virgin IslanderUgandanUkrainianUruguayanUteVenezuelanVietnameseWelshWest IndianYakamaYaquiYugoslavianYumanYup'ikZimbabwean
Immigration
NonimmigrantsImmigrantsAfghanistanAfricaAlbaniaArgentinaArmeniaAsiaAustraliaAustriaBahamasBangladeshBarbadosBelarusBelgiumBelizeBoliviaBosnia and HerzegovinaBrazilBulgariaBurma/MyanmarCabo VerdeCambodiaCameroonCanadaCaribbeanCentral AmericaChileChinaColombiaCongoCosta RicaCroatiaCubaCzechoslovakiaDenmarkDominicaDominican RepublicEastern AfricaEastern AsiaEastern EuropeEcuadorEgyptEl SalvadorEnglandEritreaEthiopiaEuropeFijiFranceGermanyGreeceGrenadaGuatemalaGuyanaHaitiHondurasHong KongHungaryIndiaIndonesiaIranIraqIrelandIsraelItalyJamaicaJapanJordanKazakhstanKenyaKoreaKuwaitLaosLatin AmericaLatviaLebanonLiberiaLithuaniaMalaysiaMexicoMicronesiaMiddle AfricaMoldovaMoroccoNepalNetherlandsNicaraguaNigeriaNorth AmericaNorth MacedoniaNorthern AfricaNorthern EuropeNorwayOceaniaPakistanPanamaPeruPhilippinesPolandPortugalRomaniaRussiaSaudi ArabiaScotlandSenegalSerbiaSierra LeoneSingaporeSomaliaSouth AfricaSouth AmericaSouth Central AsiaSouth Eastern AsiaSouthern EuropeSpainSri LankaSt. Vincent and the GrenadinesSudanSwedenSwitzerlandSyriaTaiwanThailandTrinidad and TobagoTurkeyUgandaUkraineUruguayUzbekistanVenezuelaVietnamWest IndiesWestern AfricaWestern AsiaWestern EuropeYemenZaireZimbabweAzores
Immigrants from Ghana
Race
Ancestry
AfghanAfricanAlaska NativeAlaskan AthabascanAlbanianAleutAlsatianAmericanApacheArabArapahoArgentineanArmenianAssyrian/Chaldean/SyriacAustralianAustrianBahamianBangladeshiBarbadianBasqueBelgianBelizeanBermudanBhutaneseBlackfeetBolivianBrazilianBritishBritish West IndianBulgarianBurmeseCajunCambodianCanadianCape VerdeanCarpatho RusynCelticCentral AmericanCentral American IndianCherokeeCheyenneChickasawChileanChineseChippewaChoctawColombianColvilleComancheCosta RicanCreeCreekCroatianCrowCubanCypriotCzechCzechoslovakianDanishDelawareDominicanDutchDutch West IndianEastern EuropeanEcuadorianEgyptianEnglishEstonianEthiopianEuropeanFijianFilipinoFinnishFrenchFrench American IndianFrench CanadianGermanGerman RussianGhanaianGreekGuamanian/ChamorroGuatemalanGuyaneseHaitianHmongHonduranHopiHoumaHungarianIcelanderIndian (Asian)IndonesianInupiatIranianIraqiIrishIroquoisIsraeliItalianJamaicanJapaneseJordanianKenyanKiowaKoreanLaotianLatvianLebaneseLiberianLithuanianLumbeeLuxembourgerMacedonianMalaysianMalteseMarshalleseMenomineeMexicanMexican American IndianMongolianMoroccanNative HawaiianNavajoNepaleseNew ZealanderNicaraguanNigerianNorthern EuropeanNorwegianOkinawanOsageOttawaPaiutePakistaniPalestinianPanamanianParaguayanPennsylvania GermanPeruvianPimaPolishPortuguesePotawatomiPuebloPuerto RicanPuget Sound SalishRomanianRussianSalvadoranSamoanScandinavianScotch-IrishScottishSeminoleSenegaleseSerbianShoshoneSierra LeoneanSiouxSlavicSlovakSloveneSomaliSouth AfricanSouth AmericanSouth American IndianSoviet UnionSpaniardSpanishSpanish AmericanSpanish American IndianSri LankanSubsaharan AfricanSudaneseSwedishSwissSyrianTaiwaneseThaiTlingit-HaidaTohono O'OdhamTonganTrinidadian and TobagonianTsimshianTurkishU.S. Virgin IslanderUgandanUkrainianUruguayanUteVenezuelanVietnameseWelshWest IndianYakamaYaquiYugoslavianYumanYup'ikZimbabwean
Immigration
NonimmigrantsImmigrantsAfghanistanAfricaAlbaniaArgentinaArmeniaAsiaAustraliaAustriaBahamasBangladeshBarbadosBelarusBelgiumBelizeBoliviaBosnia and HerzegovinaBrazilBulgariaBurma/MyanmarCabo VerdeCambodiaCameroonCanadaCaribbeanCentral AmericaChileChinaColombiaCongoCosta RicaCroatiaCubaCzechoslovakiaDenmarkDominicaDominican RepublicEastern AfricaEastern AsiaEastern EuropeEcuadorEgyptEl SalvadorEnglandEritreaEuropeFijiFranceGermanyGhanaGreeceGrenadaGuatemalaGuyanaHaitiHondurasHong KongHungaryIndiaIndonesiaIranIraqIrelandIsraelItalyJamaicaJapanJordanKazakhstanKenyaKoreaKuwaitLaosLatin AmericaLatviaLebanonLiberiaLithuaniaMalaysiaMexicoMicronesiaMiddle AfricaMoldovaMoroccoNepalNetherlandsNicaraguaNigeriaNorth AmericaNorth MacedoniaNorthern AfricaNorthern EuropeNorwayOceaniaPakistanPanamaPeruPhilippinesPolandPortugalRomaniaRussiaSaudi ArabiaScotlandSenegalSerbiaSierra LeoneSingaporeSomaliaSouth AfricaSouth AmericaSouth Central AsiaSouth Eastern AsiaSouthern EuropeSpainSri LankaSt. Vincent and the GrenadinesSudanSwedenSwitzerlandSyriaTaiwanThailandTrinidad and TobagoTurkeyUgandaUkraineUruguayUzbekistanVenezuelaVietnamWest IndiesWestern AfricaWestern AsiaWestern EuropeYemenZaireZimbabweAzores
Unemployment Among Seniors over 65 years
Income
Poverty
Unemployment
Labor Participation
Family Structure
Vehicle Availability
Education Level
Disability

Unemployment Among Seniors over 65 years Comparison

Immigrants from Ethiopia

Immigrants from Ghana

Exceptional
Tragic
5.0%
UNEMPLOYMENT AMONG SENIORS OVER 65 YEARS
98.6/ 100
METRIC RATING
80th/ 347
METRIC RANK
5.4%
UNEMPLOYMENT AMONG SENIORS OVER 65 YEARS
0.4/ 100
METRIC RATING
259th/ 347
METRIC RANK

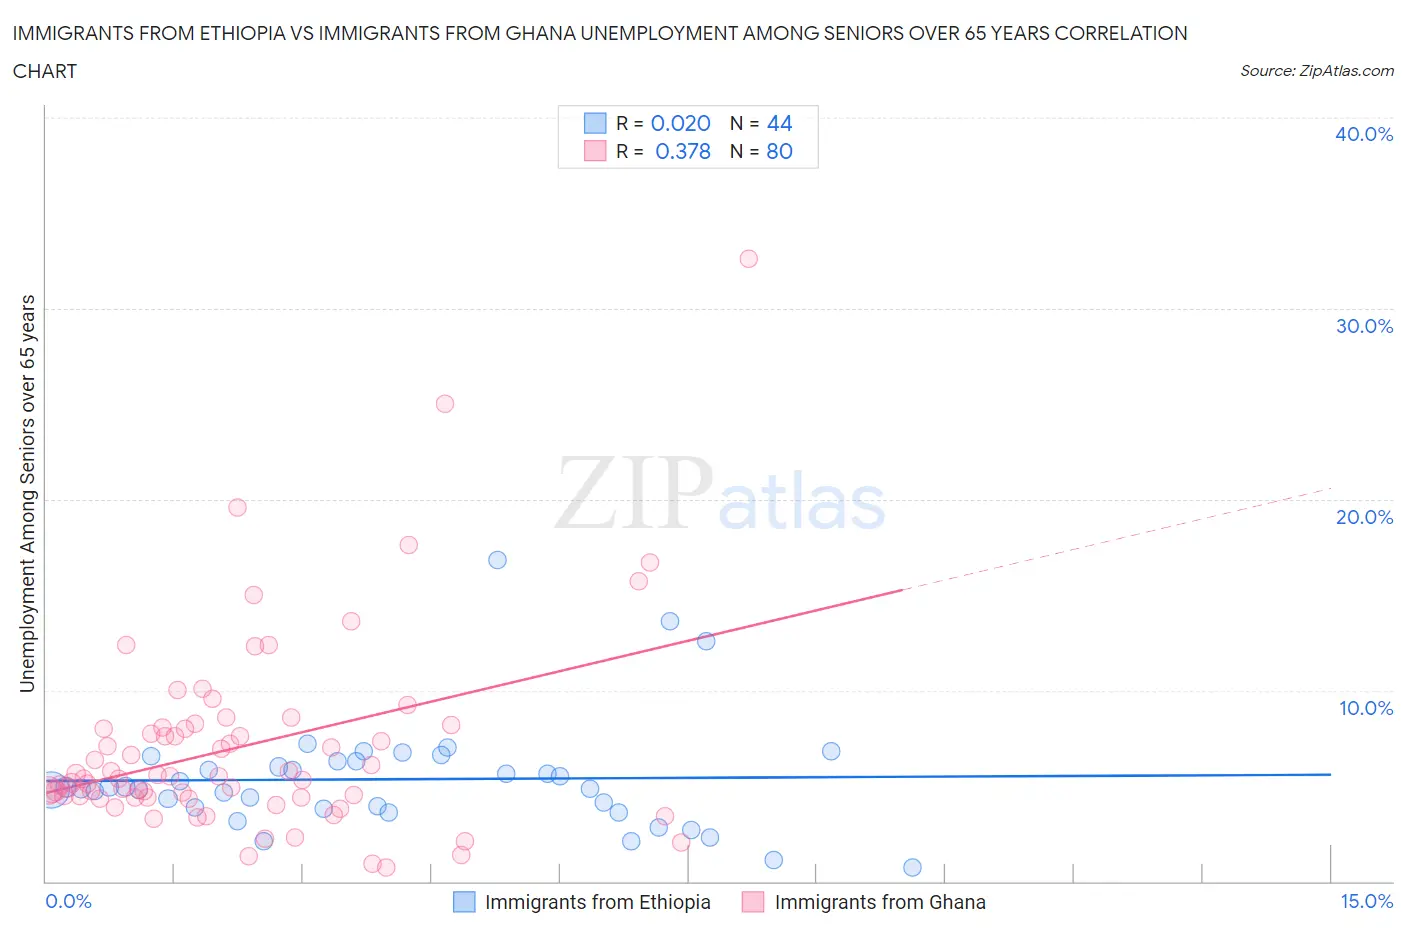
Immigrants from Ethiopia vs Immigrants from Ghana Unemployment Among Seniors over 65 years Correlation Chart

The statistical analysis conducted on geographies consisting of 199,825,119 people shows no correlation between the proportion of Immigrants from Ethiopia and unemployment rate amomg seniors over the age of 65 in the United States with a correlation coefficient (R) of 0.020 and weighted average of 5.0%. Similarly, the statistical analysis conducted on geographies consisting of 189,646,987 people shows a mild positive correlation between the proportion of Immigrants from Ghana and unemployment rate amomg seniors over the age of 65 in the United States with a correlation coefficient (R) of 0.378 and weighted average of 5.4%, a difference of 8.2%.
Immigrants from Ethiopia vs Immigrants from Ghana Unemployment Among Seniors over 65 years

Unemployment Among Seniors over 65 years Correlation Summary

MeasurementImmigrants from EthiopiaImmigrants from Ghana
Minimum0.70%0.70%
Maximum16.8%32.6%
Range16.1%31.9%
Mean5.3%7.1%
Median4.9%5.4%
Interquartile 25% (IQ1)3.8%4.4%
Interquartile 75% (IQ3)6.3%8.0%
Interquartile Range (IQR)2.4%3.6%
Standard Deviation (Sample)3.0%5.2%
Standard Deviation (Population)2.9%5.1%

Similar Demographics by Unemployment Among Seniors over 65 years

Demographics Similar to Immigrants from Ethiopia by Unemployment Among Seniors over 65 years

In terms of unemployment among seniors over 65 years, the demographic groups most similar to Immigrants from Ethiopia are Immigrants from Netherlands (5.0%, a difference of 0.10%), Estonian (5.0%, a difference of 0.10%), Serbian (5.0%, a difference of 0.13%), Slavic (5.0%, a difference of 0.15%), and Immigrants from Zimbabwe (5.0%, a difference of 0.16%).
DemographicsRating | RankUnemployment Among Seniors over 65 years
Immigrants | Japan
99.2
/100
|
#73
Exceptional
4.9%
Japanese
99.2
/100
|
#74
Exceptional
4.9%
British
99.1
/100
|
#75
Exceptional
4.9%
Welsh
99.1
/100
|
#76
Exceptional
5.0%
Thais
99.1
/100
|
#77
Exceptional
5.0%
Slavs
98.9
/100
|
#78
Exceptional
5.0%
Immigrants | Netherlands
98.8
/100
|
#79
Exceptional
5.0%
Immigrants | Ethiopia
98.6
/100
|
#80
Exceptional
5.0%
Estonians
98.5
/100
|
#81
Exceptional
5.0%
Serbians
98.4
/100
|
#82
Exceptional
5.0%
Immigrants | Zimbabwe
98.3
/100
|
#83
Exceptional
5.0%
Filipinos
98.3
/100
|
#84
Exceptional
5.0%
Immigrants | Hungary
98.2
/100
|
#85
Exceptional
5.0%
Immigrants | Taiwan
98.2
/100
|
#86
Exceptional
5.0%
Immigrants | Switzerland
98.2
/100
|
#87
Exceptional
5.0%

Demographics Similar to Immigrants from Ghana by Unemployment Among Seniors over 65 years

In terms of unemployment among seniors over 65 years, the demographic groups most similar to Immigrants from Ghana are Sierra Leonean (5.4%, a difference of 0.070%), Immigrants from Micronesia (5.4%, a difference of 0.15%), Native Hawaiian (5.4%, a difference of 0.23%), Moroccan (5.4%, a difference of 0.24%), and Paraguayan (5.4%, a difference of 0.27%).
DemographicsRating | RankUnemployment Among Seniors over 65 years
Trinidadians and Tobagonians
0.6
/100
|
#252
Tragic
5.4%
Immigrants | Sierra Leone
0.6
/100
|
#253
Tragic
5.4%
Paraguayans
0.5
/100
|
#254
Tragic
5.4%
Immigrants | Peru
0.5
/100
|
#255
Tragic
5.4%
Moroccans
0.5
/100
|
#256
Tragic
5.4%
Immigrants | Micronesia
0.4
/100
|
#257
Tragic
5.4%
Sierra Leoneans
0.4
/100
|
#258
Tragic
5.4%
Immigrants | Ghana
0.4
/100
|
#259
Tragic
5.4%
Native Hawaiians
0.3
/100
|
#260
Tragic
5.4%
Spanish American Indians
0.2
/100
|
#261
Tragic
5.4%
Immigrants | Grenada
0.2
/100
|
#262
Tragic
5.4%
South Americans
0.2
/100
|
#263
Tragic
5.4%
Central American Indians
0.2
/100
|
#264
Tragic
5.4%
Immigrants | Colombia
0.2
/100
|
#265
Tragic
5.4%
Pennsylvania Germans
0.2
/100
|
#266
Tragic
5.4%