Immigrants from England vs Immigrants from Dominica Unemployment Among Ages 55 to 59 years

COMPARE

Immigrants from England
Race
Ancestry
AfghanAfricanAlaska NativeAlaskan AthabascanAlbanianAleutAlsatianAmericanApacheArabArapahoArgentineanArmenianAssyrian/Chaldean/SyriacAustralianAustrianBahamianBangladeshiBarbadianBasqueBelgianBelizeanBermudanBhutaneseBlackfeetBolivianBrazilianBritishBritish West IndianBulgarianBurmeseCajunCambodianCanadianCape VerdeanCarpatho RusynCelticCentral AmericanCentral American IndianCherokeeCheyenneChickasawChileanChineseChippewaChoctawColombianColvilleComancheCosta RicanCreeCreekCroatianCrowCubanCypriotCzechCzechoslovakianDanishDelawareDominicanDutchDutch West IndianEastern EuropeanEcuadorianEgyptianEnglishEstonianEthiopianEuropeanFijianFilipinoFinnishFrenchFrench American IndianFrench CanadianGermanGerman RussianGhanaianGreekGuamanian/ChamorroGuatemalanGuyaneseHaitianHmongHonduranHopiHoumaHungarianIcelanderIndian (Asian)IndonesianInupiatIranianIraqiIrishIroquoisIsraeliItalianJamaicanJapaneseJordanianKenyanKiowaKoreanLaotianLatvianLebaneseLiberianLithuanianLumbeeLuxembourgerMacedonianMalaysianMalteseMarshalleseMenomineeMexicanMexican American IndianMongolianMoroccanNative HawaiianNavajoNepaleseNew ZealanderNicaraguanNigerianNorthern EuropeanNorwegianOkinawanOsageOttawaPaiutePakistaniPalestinianPanamanianParaguayanPennsylvania GermanPeruvianPimaPolishPortuguesePotawatomiPuebloPuerto RicanPuget Sound SalishRomanianRussianSalvadoranSamoanScandinavianScotch-IrishScottishSeminoleSenegaleseSerbianShoshoneSierra LeoneanSiouxSlavicSlovakSloveneSomaliSouth AfricanSouth AmericanSouth American IndianSoviet UnionSpaniardSpanishSpanish AmericanSpanish American IndianSri LankanSubsaharan AfricanSudaneseSwedishSwissSyrianTaiwaneseThaiTlingit-HaidaTohono O'OdhamTonganTrinidadian and TobagonianTsimshianTurkishU.S. Virgin IslanderUgandanUkrainianUruguayanUteVenezuelanVietnameseWelshWest IndianYakamaYaquiYugoslavianYumanYup'ikZimbabwean
Immigration
NonimmigrantsImmigrantsAfghanistanAfricaAlbaniaArgentinaArmeniaAsiaAustraliaAustriaBahamasBangladeshBarbadosBelarusBelgiumBelizeBoliviaBosnia and HerzegovinaBrazilBulgariaBurma/MyanmarCabo VerdeCambodiaCameroonCanadaCaribbeanCentral AmericaChileChinaColombiaCongoCosta RicaCroatiaCubaCzechoslovakiaDenmarkDominican RepublicEastern AfricaEastern AsiaEastern EuropeEcuadorEgyptEl SalvadorEnglandEritreaEthiopiaEuropeFijiFranceGermanyGhanaGreeceGrenadaGuatemalaGuyanaHaitiHondurasHong KongHungaryIndiaIndonesiaIranIraqIrelandIsraelItalyJamaicaJapanJordanKazakhstanKenyaKoreaKuwaitLaosLatin AmericaLatviaLebanonLiberiaLithuaniaMalaysiaMexicoMicronesiaMiddle AfricaMoldovaMoroccoNepalNetherlandsNicaraguaNigeriaNorth AmericaNorth MacedoniaNorthern AfricaNorthern EuropeNorwayOceaniaPakistanPanamaPeruPhilippinesPolandPortugalRomaniaRussiaSaudi ArabiaScotlandSenegalSerbiaSierra LeoneSingaporeSomaliaSouth AfricaSouth AmericaSouth Central AsiaSouth Eastern AsiaSouthern EuropeSpainSri LankaSt. Vincent and the GrenadinesSudanSwedenSwitzerlandSyriaTaiwanThailandTrinidad and TobagoTurkeyUgandaUkraineUruguayUzbekistanVenezuelaVietnamWest IndiesWestern AfricaWestern AsiaWestern EuropeYemenZaireZimbabweAzores
Immigrants from Dominica
Race
Ancestry
AfghanAfricanAlaska NativeAlaskan AthabascanAlbanianAleutAlsatianAmericanApacheArabArapahoArgentineanArmenianAssyrian/Chaldean/SyriacAustralianAustrianBahamianBangladeshiBarbadianBasqueBelgianBelizeanBermudanBhutaneseBlackfeetBolivianBrazilianBritishBritish West IndianBulgarianBurmeseCajunCambodianCanadianCape VerdeanCarpatho RusynCelticCentral AmericanCentral American IndianCherokeeCheyenneChickasawChileanChineseChippewaChoctawColombianColvilleComancheCosta RicanCreeCreekCroatianCrowCubanCypriotCzechCzechoslovakianDanishDelawareDominicanDutchDutch West IndianEastern EuropeanEcuadorianEgyptianEnglishEstonianEthiopianEuropeanFijianFilipinoFinnishFrenchFrench American IndianFrench CanadianGermanGerman RussianGhanaianGreekGuamanian/ChamorroGuatemalanGuyaneseHaitianHmongHonduranHopiHoumaHungarianIcelanderIndian (Asian)IndonesianInupiatIranianIraqiIrishIroquoisIsraeliItalianJamaicanJapaneseJordanianKenyanKiowaKoreanLaotianLatvianLebaneseLiberianLithuanianLumbeeLuxembourgerMacedonianMalaysianMalteseMarshalleseMenomineeMexicanMexican American IndianMongolianMoroccanNative HawaiianNavajoNepaleseNew ZealanderNicaraguanNigerianNorthern EuropeanNorwegianOkinawanOsageOttawaPaiutePakistaniPalestinianPanamanianParaguayanPennsylvania GermanPeruvianPimaPolishPortuguesePotawatomiPuebloPuerto RicanPuget Sound SalishRomanianRussianSalvadoranSamoanScandinavianScotch-IrishScottishSeminoleSenegaleseSerbianShoshoneSierra LeoneanSiouxSlavicSlovakSloveneSomaliSouth AfricanSouth AmericanSouth American IndianSoviet UnionSpaniardSpanishSpanish AmericanSpanish American IndianSri LankanSubsaharan AfricanSudaneseSwedishSwissSyrianTaiwaneseThaiTlingit-HaidaTohono O'OdhamTonganTrinidadian and TobagonianTsimshianTurkishU.S. Virgin IslanderUgandanUkrainianUruguayanUteVenezuelanVietnameseWelshWest IndianYakamaYaquiYugoslavianYumanYup'ikZimbabwean
Immigration
NonimmigrantsImmigrantsAfghanistanAfricaAlbaniaArgentinaArmeniaAsiaAustraliaAustriaBahamasBangladeshBarbadosBelarusBelgiumBelizeBoliviaBosnia and HerzegovinaBrazilBulgariaBurma/MyanmarCabo VerdeCambodiaCameroonCanadaCaribbeanCentral AmericaChileChinaColombiaCongoCosta RicaCroatiaCubaCzechoslovakiaDenmarkDominicaDominican RepublicEastern AfricaEastern AsiaEastern EuropeEcuadorEgyptEl SalvadorEritreaEthiopiaEuropeFijiFranceGermanyGhanaGreeceGrenadaGuatemalaGuyanaHaitiHondurasHong KongHungaryIndiaIndonesiaIranIraqIrelandIsraelItalyJamaicaJapanJordanKazakhstanKenyaKoreaKuwaitLaosLatin AmericaLatviaLebanonLiberiaLithuaniaMalaysiaMexicoMicronesiaMiddle AfricaMoldovaMoroccoNepalNetherlandsNicaraguaNigeriaNorth AmericaNorth MacedoniaNorthern AfricaNorthern EuropeNorwayOceaniaPakistanPanamaPeruPhilippinesPolandPortugalRomaniaRussiaSaudi ArabiaScotlandSenegalSerbiaSierra LeoneSingaporeSomaliaSouth AfricaSouth AmericaSouth Central AsiaSouth Eastern AsiaSouthern EuropeSpainSri LankaSt. Vincent and the GrenadinesSudanSwedenSwitzerlandSyriaTaiwanThailandTrinidad and TobagoTurkeyUgandaUkraineUruguayUzbekistanVenezuelaVietnamWest IndiesWestern AfricaWestern AsiaWestern EuropeYemenZaireZimbabweAzores
Unemployment Among Ages 55 to 59 years
Income
Poverty
Unemployment
Labor Participation
Family Structure
Vehicle Availability
Education Level
Disability

Unemployment Among Ages 55 to 59 years Comparison

Immigrants from England

Immigrants from Dominica

Exceptional
Tragic
4.7%
UNEMPLOYMENT AMONG AGES 55 TO 59 YEARS
95.8/ 100
METRIC RATING
93rd/ 347
METRIC RANK
5.5%
UNEMPLOYMENT AMONG AGES 55 TO 59 YEARS
0.0/ 100
METRIC RATING
301st/ 347
METRIC RANK

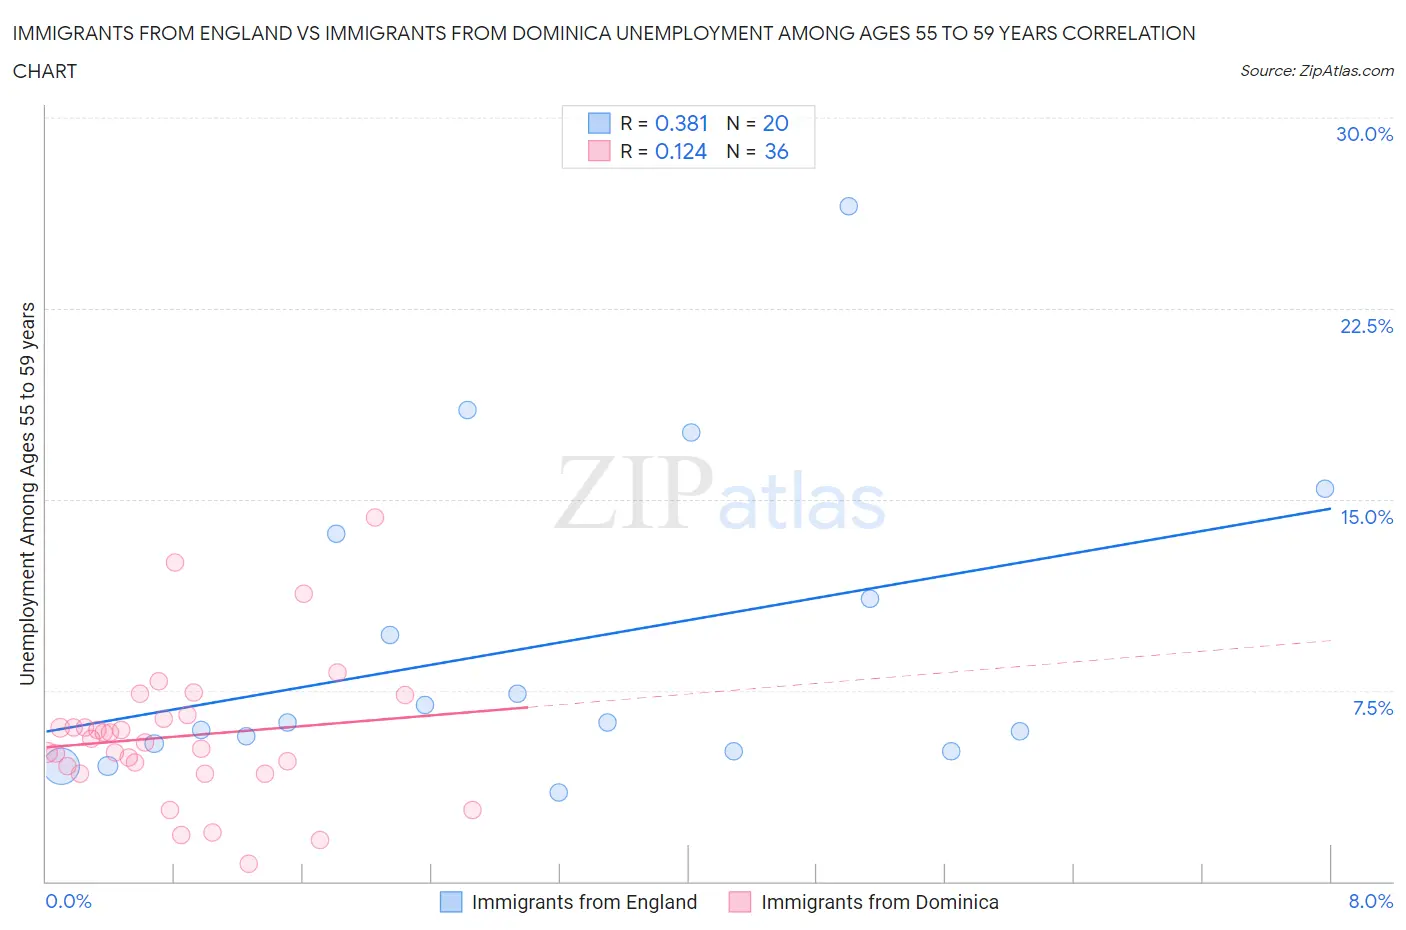
Immigrants from England vs Immigrants from Dominica Unemployment Among Ages 55 to 59 years Correlation Chart

The statistical analysis conducted on geographies consisting of 363,518,632 people shows a mild positive correlation between the proportion of Immigrants from England and unemployment rate among population between the ages 55 and 59 in the United States with a correlation coefficient (R) of 0.381 and weighted average of 4.7%. Similarly, the statistical analysis conducted on geographies consisting of 82,283,248 people shows a poor positive correlation between the proportion of Immigrants from Dominica and unemployment rate among population between the ages 55 and 59 in the United States with a correlation coefficient (R) of 0.124 and weighted average of 5.5%, a difference of 16.8%.
Immigrants from England vs Immigrants from Dominica Unemployment Among Ages 55 to 59 years

Unemployment Among Ages 55 to 59 years Correlation Summary

MeasurementImmigrants from EnglandImmigrants from Dominica
Minimum3.5%0.70%
Maximum26.5%14.3%
Range23.0%13.6%
Mean9.2%5.7%
Median6.2%5.5%
Interquartile 25% (IQ1)5.3%4.4%
Interquartile 75% (IQ3)12.4%6.5%
Interquartile Range (IQR)7.1%2.1%
Standard Deviation (Sample)6.1%2.8%
Standard Deviation (Population)5.9%2.8%

Similar Demographics by Unemployment Among Ages 55 to 59 years

Demographics Similar to Immigrants from England by Unemployment Among Ages 55 to 59 years

In terms of unemployment among ages 55 to 59 years, the demographic groups most similar to Immigrants from England are Immigrants from Scotland (4.7%, a difference of 0.0%), South African (4.7%, a difference of 0.040%), Iraqi (4.7%, a difference of 0.080%), New Zealander (4.7%, a difference of 0.16%), and Immigrants from Poland (4.7%, a difference of 0.18%).
DemographicsRating | RankUnemployment Among Ages 55 to 59 years
Immigrants | Colombia
96.9
/100
|
#86
Exceptional
4.7%
Poles
96.9
/100
|
#87
Exceptional
4.7%
Immigrants | Cameroon
96.9
/100
|
#88
Exceptional
4.7%
Irish
96.8
/100
|
#89
Exceptional
4.7%
Immigrants | Poland
96.4
/100
|
#90
Exceptional
4.7%
New Zealanders
96.3
/100
|
#91
Exceptional
4.7%
Iraqis
96.1
/100
|
#92
Exceptional
4.7%
Immigrants | England
95.8
/100
|
#93
Exceptional
4.7%
Immigrants | Scotland
95.7
/100
|
#94
Exceptional
4.7%
South Africans
95.6
/100
|
#95
Exceptional
4.7%
Immigrants | Belgium
95.0
/100
|
#96
Exceptional
4.7%
Immigrants | Canada
94.9
/100
|
#97
Exceptional
4.7%
Immigrants | Germany
94.8
/100
|
#98
Exceptional
4.7%
Yugoslavians
94.7
/100
|
#99
Exceptional
4.7%
Serbians
94.4
/100
|
#100
Exceptional
4.7%

Demographics Similar to Immigrants from Dominica by Unemployment Among Ages 55 to 59 years

In terms of unemployment among ages 55 to 59 years, the demographic groups most similar to Immigrants from Dominica are Immigrants from St. Vincent and the Grenadines (5.4%, a difference of 0.24%), Cape Verdean (5.4%, a difference of 0.38%), Sierra Leonean (5.5%, a difference of 0.40%), Marshallese (5.5%, a difference of 0.41%), and Black/African American (5.5%, a difference of 0.93%).
DemographicsRating | RankUnemployment Among Ages 55 to 59 years
Cajuns
0.0
/100
|
#294
Tragic
5.3%
Dutch West Indians
0.0
/100
|
#295
Tragic
5.3%
Barbadians
0.0
/100
|
#296
Tragic
5.3%
Immigrants | Mexico
0.0
/100
|
#297
Tragic
5.3%
Hispanics or Latinos
0.0
/100
|
#298
Tragic
5.4%
Cape Verdeans
0.0
/100
|
#299
Tragic
5.4%
Immigrants | St. Vincent and the Grenadines
0.0
/100
|
#300
Tragic
5.4%
Immigrants | Dominica
0.0
/100
|
#301
Tragic
5.5%
Sierra Leoneans
0.0
/100
|
#302
Tragic
5.5%
Marshallese
0.0
/100
|
#303
Tragic
5.5%
Blacks/African Americans
0.0
/100
|
#304
Tragic
5.5%
Immigrants | Portugal
0.0
/100
|
#305
Tragic
5.5%
Immigrants | Cabo Verde
0.0
/100
|
#306
Tragic
5.5%
Immigrants | Belize
0.0
/100
|
#307
Tragic
5.5%
Spanish American Indians
0.0
/100
|
#308
Tragic
5.6%