Immigrants from Egypt vs Pueblo Unemployment Among Ages 55 to 59 years

COMPARE

Immigrants from Egypt
Race
Ancestry
AfghanAfricanAlaska NativeAlaskan AthabascanAlbanianAleutAlsatianAmericanApacheArabArapahoArgentineanArmenianAssyrian/Chaldean/SyriacAustralianAustrianBahamianBangladeshiBarbadianBasqueBelgianBelizeanBermudanBhutaneseBlackfeetBolivianBrazilianBritishBritish West IndianBulgarianBurmeseCajunCambodianCanadianCape VerdeanCarpatho RusynCelticCentral AmericanCentral American IndianCherokeeCheyenneChickasawChileanChineseChippewaChoctawColombianColvilleComancheCosta RicanCreeCreekCroatianCrowCubanCypriotCzechCzechoslovakianDanishDelawareDominicanDutchDutch West IndianEastern EuropeanEcuadorianEgyptianEnglishEstonianEthiopianEuropeanFijianFilipinoFinnishFrenchFrench American IndianFrench CanadianGermanGerman RussianGhanaianGreekGuamanian/ChamorroGuatemalanGuyaneseHaitianHmongHonduranHopiHoumaHungarianIcelanderIndian (Asian)IndonesianInupiatIranianIraqiIrishIroquoisIsraeliItalianJamaicanJapaneseJordanianKenyanKiowaKoreanLaotianLatvianLebaneseLiberianLithuanianLumbeeLuxembourgerMacedonianMalaysianMalteseMarshalleseMenomineeMexicanMexican American IndianMongolianMoroccanNative HawaiianNavajoNepaleseNew ZealanderNicaraguanNigerianNorthern EuropeanNorwegianOkinawanOsageOttawaPaiutePakistaniPalestinianPanamanianParaguayanPennsylvania GermanPeruvianPimaPolishPortuguesePotawatomiPuerto RicanPuget Sound SalishRomanianRussianSalvadoranSamoanScandinavianScotch-IrishScottishSeminoleSenegaleseSerbianShoshoneSierra LeoneanSiouxSlavicSlovakSloveneSomaliSouth AfricanSouth AmericanSouth American IndianSoviet UnionSpaniardSpanishSpanish AmericanSpanish American IndianSri LankanSubsaharan AfricanSudaneseSwedishSwissSyrianTaiwaneseThaiTlingit-HaidaTohono O'OdhamTonganTrinidadian and TobagonianTsimshianTurkishU.S. Virgin IslanderUgandanUkrainianUruguayanUteVenezuelanVietnameseWelshWest IndianYakamaYaquiYugoslavianYumanYup'ikZimbabwean
Immigration
NonimmigrantsImmigrantsAfghanistanAfricaAlbaniaArgentinaArmeniaAsiaAustraliaAustriaBahamasBangladeshBarbadosBelarusBelgiumBelizeBoliviaBosnia and HerzegovinaBrazilBulgariaBurma/MyanmarCabo VerdeCambodiaCameroonCanadaCaribbeanCentral AmericaChileChinaColombiaCongoCosta RicaCroatiaCubaCzechoslovakiaDenmarkDominicaDominican RepublicEastern AfricaEastern AsiaEastern EuropeEcuadorEgyptEl SalvadorEnglandEritreaEthiopiaEuropeFijiFranceGermanyGhanaGreeceGrenadaGuatemalaGuyanaHaitiHondurasHong KongHungaryIndiaIndonesiaIranIraqIrelandIsraelItalyJamaicaJapanJordanKazakhstanKenyaKoreaKuwaitLaosLatin AmericaLatviaLebanonLiberiaLithuaniaMalaysiaMexicoMicronesiaMiddle AfricaMoldovaMoroccoNepalNetherlandsNicaraguaNigeriaNorth AmericaNorth MacedoniaNorthern AfricaNorthern EuropeNorwayOceaniaPakistanPanamaPeruPhilippinesPolandPortugalRomaniaRussiaSaudi ArabiaScotlandSenegalSerbiaSierra LeoneSingaporeSomaliaSouth AfricaSouth AmericaSouth Central AsiaSouth Eastern AsiaSouthern EuropeSpainSri LankaSt. Vincent and the GrenadinesSudanSwedenSwitzerlandSyriaTaiwanThailandTrinidad and TobagoTurkeyUgandaUkraineUruguayUzbekistanVenezuelaVietnamWest IndiesWestern AfricaWestern AsiaWestern EuropeYemenZaireZimbabweAzores
Pueblo
Race
Ancestry
AfghanAfricanAlaska NativeAlaskan AthabascanAlbanianAleutAlsatianAmericanApacheArabArapahoArgentineanArmenianAssyrian/Chaldean/SyriacAustralianAustrianBahamianBangladeshiBarbadianBasqueBelgianBelizeanBermudanBhutaneseBlackfeetBolivianBrazilianBritishBritish West IndianBulgarianBurmeseCajunCambodianCanadianCape VerdeanCarpatho RusynCelticCentral AmericanCentral American IndianCherokeeCheyenneChickasawChileanChineseChippewaChoctawColombianColvilleComancheCosta RicanCreeCreekCroatianCrowCubanCypriotCzechCzechoslovakianDanishDelawareDominicanDutchDutch West IndianEastern EuropeanEcuadorianEgyptianEnglishEstonianEthiopianEuropeanFijianFilipinoFinnishFrenchFrench American IndianFrench CanadianGermanGerman RussianGhanaianGreekGuamanian/ChamorroGuatemalanGuyaneseHaitianHmongHonduranHopiHoumaHungarianIcelanderIndian (Asian)IndonesianInupiatIranianIraqiIrishIroquoisIsraeliItalianJamaicanJapaneseJordanianKenyanKiowaKoreanLaotianLatvianLebaneseLiberianLithuanianLumbeeLuxembourgerMacedonianMalaysianMalteseMarshalleseMenomineeMexicanMexican American IndianMongolianMoroccanNative HawaiianNavajoNepaleseNew ZealanderNicaraguanNigerianNorthern EuropeanNorwegianOkinawanOsageOttawaPaiutePakistaniPalestinianPanamanianParaguayanPennsylvania GermanPeruvianPimaPolishPortuguesePotawatomiPuebloPuerto RicanPuget Sound SalishRomanianRussianSalvadoranSamoanScandinavianScotch-IrishScottishSeminoleSenegaleseSerbianShoshoneSierra LeoneanSiouxSlavicSlovakSloveneSomaliSouth AfricanSouth AmericanSouth American IndianSoviet UnionSpaniardSpanishSpanish AmericanSpanish American IndianSri LankanSubsaharan AfricanSudaneseSwedishSwissSyrianTaiwaneseThaiTlingit-HaidaTohono O'OdhamTonganTrinidadian and TobagonianTsimshianTurkishU.S. Virgin IslanderUgandanUkrainianUruguayanUteVenezuelanVietnameseWelshWest IndianYakamaYaquiYugoslavianYumanYup'ikZimbabwean
Immigration
NonimmigrantsImmigrantsAfghanistanAfricaAlbaniaArgentinaArmeniaAsiaAustraliaAustriaBahamasBangladeshBarbadosBelarusBelgiumBelizeBoliviaBosnia and HerzegovinaBrazilBulgariaBurma/MyanmarCabo VerdeCambodiaCameroonCanadaCaribbeanCentral AmericaChileChinaColombiaCongoCosta RicaCroatiaCubaCzechoslovakiaDenmarkDominicaDominican RepublicEastern AfricaEastern AsiaEastern EuropeEcuadorEl SalvadorEnglandEritreaEthiopiaEuropeFijiFranceGermanyGhanaGreeceGrenadaGuatemalaGuyanaHaitiHondurasHong KongHungaryIndiaIndonesiaIranIraqIrelandIsraelItalyJamaicaJapanJordanKazakhstanKenyaKoreaKuwaitLaosLatin AmericaLatviaLebanonLiberiaLithuaniaMalaysiaMexicoMicronesiaMiddle AfricaMoldovaMoroccoNepalNetherlandsNicaraguaNigeriaNorth AmericaNorth MacedoniaNorthern AfricaNorthern EuropeNorwayOceaniaPakistanPanamaPeruPhilippinesPolandPortugalRomaniaRussiaSaudi ArabiaScotlandSenegalSerbiaSierra LeoneSingaporeSomaliaSouth AfricaSouth AmericaSouth Central AsiaSouth Eastern AsiaSouthern EuropeSpainSri LankaSt. Vincent and the GrenadinesSudanSwedenSwitzerlandSyriaTaiwanThailandTrinidad and TobagoTurkeyUgandaUkraineUruguayUzbekistanVenezuelaVietnamWest IndiesWestern AfricaWestern AsiaWestern EuropeYemenZaireZimbabweAzores
Unemployment Among Ages 55 to 59 years
Income
Poverty
Unemployment
Labor Participation
Family Structure
Vehicle Availability
Education Level
Disability

Unemployment Among Ages 55 to 59 years Comparison

Immigrants from Egypt

Pueblo

Exceptional
Tragic
4.7%
UNEMPLOYMENT AMONG AGES 55 TO 59 YEARS
93.5/ 100
METRIC RATING
107th/ 347
METRIC RANK
6.7%
UNEMPLOYMENT AMONG AGES 55 TO 59 YEARS
0.0/ 100
METRIC RATING
334th/ 347
METRIC RANK

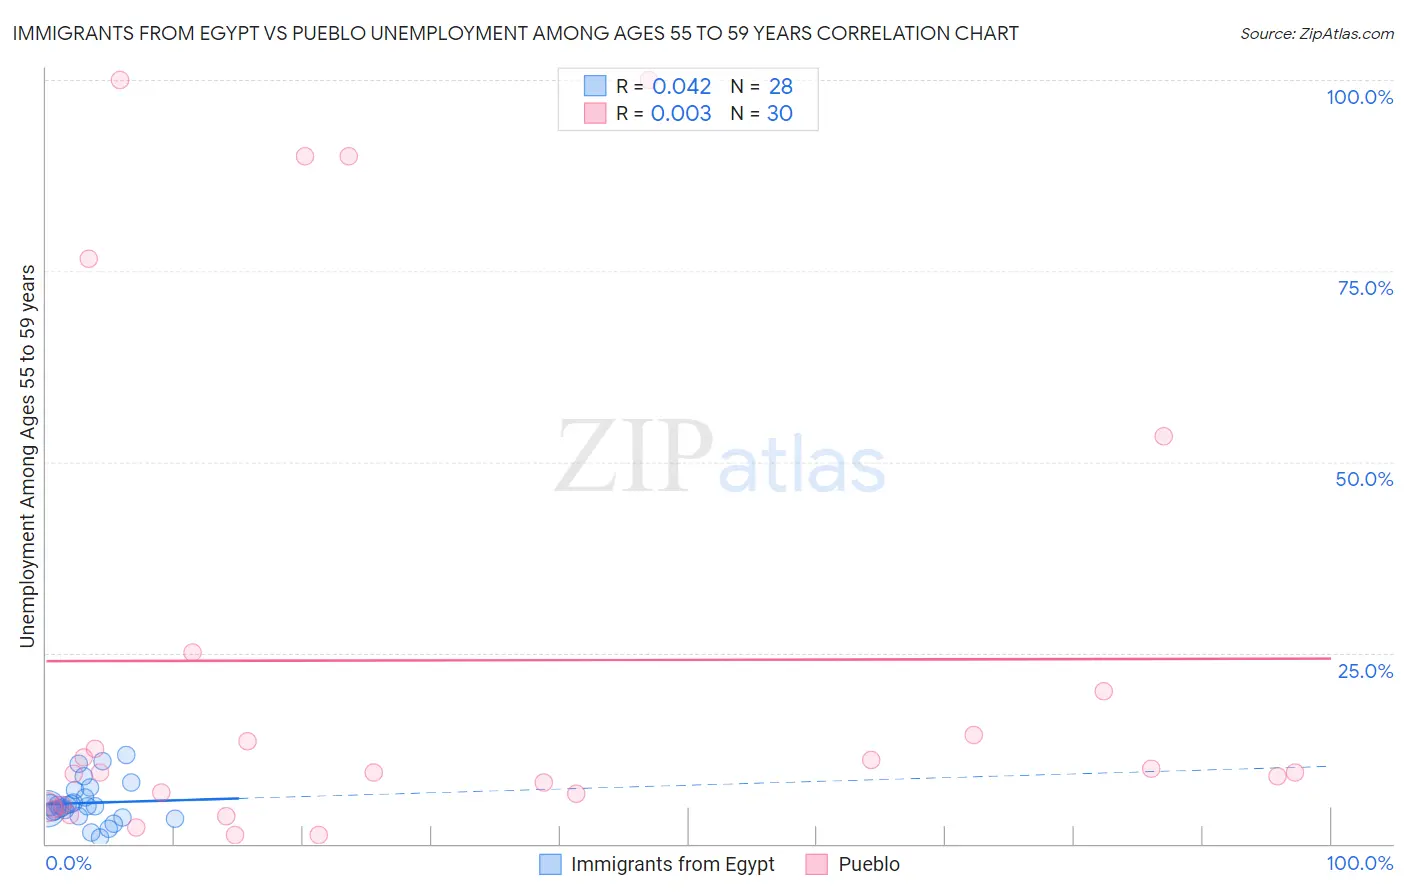
Immigrants from Egypt vs Pueblo Unemployment Among Ages 55 to 59 years Correlation Chart

The statistical analysis conducted on geographies consisting of 236,678,823 people shows no correlation between the proportion of Immigrants from Egypt and unemployment rate among population between the ages 55 and 59 in the United States with a correlation coefficient (R) of 0.042 and weighted average of 4.7%. Similarly, the statistical analysis conducted on geographies consisting of 117,207,803 people shows no correlation between the proportion of Pueblo and unemployment rate among population between the ages 55 and 59 in the United States with a correlation coefficient (R) of 0.003 and weighted average of 6.7%, a difference of 42.9%.
Immigrants from Egypt vs Pueblo Unemployment Among Ages 55 to 59 years

Unemployment Among Ages 55 to 59 years Correlation Summary

MeasurementImmigrants from EgyptPueblo
Minimum0.80%1.1%
Maximum11.6%100.0%
Range10.8%98.9%
Mean5.3%24.0%
Median4.9%9.3%
Interquartile 25% (IQ1)3.9%5.1%
Interquartile 75% (IQ3)6.5%20.0%
Interquartile Range (IQR)2.6%14.9%
Standard Deviation (Sample)2.7%32.3%
Standard Deviation (Population)2.6%31.7%

Similar Demographics by Unemployment Among Ages 55 to 59 years

Demographics Similar to Immigrants from Egypt by Unemployment Among Ages 55 to 59 years

In terms of unemployment among ages 55 to 59 years, the demographic groups most similar to Immigrants from Egypt are French (4.7%, a difference of 0.040%), Chilean (4.7%, a difference of 0.050%), Immigrants from Laos (4.7%, a difference of 0.060%), Immigrants from North America (4.7%, a difference of 0.070%), and Immigrants from Turkey (4.7%, a difference of 0.080%).
DemographicsRating | RankUnemployment Among Ages 55 to 59 years
Serbians
94.4
/100
|
#100
Exceptional
4.7%
Celtics
94.3
/100
|
#101
Exceptional
4.7%
Canadians
94.1
/100
|
#102
Exceptional
4.7%
Immigrants | Oceania
94.0
/100
|
#103
Exceptional
4.7%
Immigrants | Turkey
93.9
/100
|
#104
Exceptional
4.7%
Immigrants | North America
93.9
/100
|
#105
Exceptional
4.7%
Immigrants | Laos
93.9
/100
|
#106
Exceptional
4.7%
Immigrants | Egypt
93.5
/100
|
#107
Exceptional
4.7%
French
93.3
/100
|
#108
Exceptional
4.7%
Chileans
93.2
/100
|
#109
Exceptional
4.7%
Egyptians
92.9
/100
|
#110
Exceptional
4.7%
Austrians
92.4
/100
|
#111
Exceptional
4.7%
Afghans
92.1
/100
|
#112
Exceptional
4.7%
Immigrants | Spain
91.4
/100
|
#113
Exceptional
4.7%
Bangladeshis
91.3
/100
|
#114
Exceptional
4.7%

Demographics Similar to Pueblo by Unemployment Among Ages 55 to 59 years

In terms of unemployment among ages 55 to 59 years, the demographic groups most similar to Pueblo are Colville (6.7%, a difference of 0.18%), Navajo (6.7%, a difference of 0.33%), Paiute (6.8%, a difference of 0.85%), Pima (6.6%, a difference of 1.2%), and Immigrants from Yemen (6.9%, a difference of 2.8%).
DemographicsRating | RankUnemployment Among Ages 55 to 59 years
Arapaho
0.0
/100
|
#327
Tragic
6.1%
Yuman
0.0
/100
|
#328
Tragic
6.1%
Dominicans
0.0
/100
|
#329
Tragic
6.2%
Alaska Natives
0.0
/100
|
#330
Tragic
6.2%
Immigrants | Dominican Republic
0.0
/100
|
#331
Tragic
6.3%
Aleuts
0.0
/100
|
#332
Tragic
6.4%
Pima
0.0
/100
|
#333
Tragic
6.6%
Pueblo
0.0
/100
|
#334
Tragic
6.7%
Colville
0.0
/100
|
#335
Tragic
6.7%
Navajo
0.0
/100
|
#336
Tragic
6.7%
Paiute
0.0
/100
|
#337
Tragic
6.8%
Immigrants | Yemen
0.0
/100
|
#338
Tragic
6.9%
Puerto Ricans
0.0
/100
|
#339
Tragic
7.0%
Alaskan Athabascans
0.0
/100
|
#340
Tragic
7.1%
Shoshone
0.0
/100
|
#341
Tragic
7.4%