Immigrants from Eastern Europe vs Immigrants from China Unemployment Among Ages 25 to 29 years

COMPARE

Immigrants from Eastern Europe
Race
Ancestry
AfghanAfricanAlaska NativeAlaskan AthabascanAlbanianAleutAlsatianAmericanApacheArabArapahoArgentineanArmenianAssyrian/Chaldean/SyriacAustralianAustrianBahamianBangladeshiBarbadianBasqueBelgianBelizeanBermudanBhutaneseBlackfeetBolivianBrazilianBritishBritish West IndianBulgarianBurmeseCajunCambodianCanadianCape VerdeanCarpatho RusynCelticCentral AmericanCentral American IndianCherokeeCheyenneChickasawChileanChineseChippewaChoctawColombianColvilleComancheCosta RicanCreeCreekCroatianCrowCubanCypriotCzechCzechoslovakianDanishDelawareDominicanDutchDutch West IndianEastern EuropeanEcuadorianEgyptianEnglishEstonianEthiopianEuropeanFijianFilipinoFinnishFrenchFrench American IndianFrench CanadianGermanGerman RussianGhanaianGreekGuamanian/ChamorroGuatemalanGuyaneseHaitianHmongHonduranHopiHoumaHungarianIcelanderIndian (Asian)IndonesianInupiatIranianIraqiIrishIroquoisIsraeliItalianJamaicanJapaneseJordanianKenyanKiowaKoreanLaotianLatvianLebaneseLiberianLithuanianLumbeeLuxembourgerMacedonianMalaysianMalteseMarshalleseMenomineeMexicanMexican American IndianMongolianMoroccanNative HawaiianNavajoNepaleseNew ZealanderNicaraguanNigerianNorthern EuropeanNorwegianOkinawanOsageOttawaPaiutePakistaniPalestinianPanamanianParaguayanPennsylvania GermanPeruvianPimaPolishPortuguesePotawatomiPuebloPuerto RicanPuget Sound SalishRomanianRussianSalvadoranSamoanScandinavianScotch-IrishScottishSeminoleSenegaleseSerbianShoshoneSierra LeoneanSiouxSlavicSlovakSloveneSomaliSouth AfricanSouth AmericanSouth American IndianSoviet UnionSpaniardSpanishSpanish AmericanSpanish American IndianSri LankanSubsaharan AfricanSudaneseSwedishSwissSyrianTaiwaneseThaiTlingit-HaidaTohono O'OdhamTonganTrinidadian and TobagonianTsimshianTurkishU.S. Virgin IslanderUgandanUkrainianUruguayanUteVenezuelanVietnameseWelshWest IndianYakamaYaquiYugoslavianYumanYup'ikZimbabwean
Immigration
NonimmigrantsImmigrantsAfghanistanAfricaAlbaniaArgentinaArmeniaAsiaAustraliaAustriaBahamasBangladeshBarbadosBelarusBelgiumBelizeBoliviaBosnia and HerzegovinaBrazilBulgariaBurma/MyanmarCabo VerdeCambodiaCameroonCanadaCaribbeanCentral AmericaChileColombiaCongoCosta RicaCroatiaCubaCzechoslovakiaDenmarkDominicaDominican RepublicEastern AfricaEastern AsiaEastern EuropeEcuadorEgyptEl SalvadorEnglandEritreaEthiopiaEuropeFijiFranceGermanyGhanaGreeceGrenadaGuatemalaGuyanaHaitiHondurasHong KongHungaryIndiaIndonesiaIranIraqIrelandIsraelItalyJamaicaJapanJordanKazakhstanKenyaKoreaKuwaitLaosLatin AmericaLatviaLebanonLiberiaLithuaniaMalaysiaMexicoMicronesiaMiddle AfricaMoldovaMoroccoNepalNetherlandsNicaraguaNigeriaNorth AmericaNorth MacedoniaNorthern AfricaNorthern EuropeNorwayOceaniaPakistanPanamaPeruPhilippinesPolandPortugalRomaniaRussiaSaudi ArabiaScotlandSenegalSerbiaSierra LeoneSingaporeSomaliaSouth AfricaSouth AmericaSouth Central AsiaSouth Eastern AsiaSouthern EuropeSpainSri LankaSt. Vincent and the GrenadinesSudanSwedenSwitzerlandSyriaTaiwanThailandTrinidad and TobagoTurkeyUgandaUkraineUruguayUzbekistanVenezuelaVietnamWest IndiesWestern AfricaWestern AsiaWestern EuropeYemenZaireZimbabweAzores
Immigrants from China
Race
Ancestry
AfghanAfricanAlaska NativeAlaskan AthabascanAlbanianAleutAlsatianAmericanApacheArabArapahoArgentineanArmenianAssyrian/Chaldean/SyriacAustralianAustrianBahamianBangladeshiBarbadianBasqueBelgianBelizeanBermudanBhutaneseBlackfeetBolivianBrazilianBritishBritish West IndianBulgarianBurmeseCajunCambodianCanadianCape VerdeanCarpatho RusynCelticCentral AmericanCentral American IndianCherokeeCheyenneChickasawChileanChineseChippewaChoctawColombianColvilleComancheCosta RicanCreeCreekCroatianCrowCubanCypriotCzechCzechoslovakianDanishDelawareDominicanDutchDutch West IndianEastern EuropeanEcuadorianEgyptianEnglishEstonianEthiopianEuropeanFijianFilipinoFinnishFrenchFrench American IndianFrench CanadianGermanGerman RussianGhanaianGreekGuamanian/ChamorroGuatemalanGuyaneseHaitianHmongHonduranHopiHoumaHungarianIcelanderIndian (Asian)IndonesianInupiatIranianIraqiIrishIroquoisIsraeliItalianJamaicanJapaneseJordanianKenyanKiowaKoreanLaotianLatvianLebaneseLiberianLithuanianLumbeeLuxembourgerMacedonianMalaysianMalteseMarshalleseMenomineeMexicanMexican American IndianMongolianMoroccanNative HawaiianNavajoNepaleseNew ZealanderNicaraguanNigerianNorthern EuropeanNorwegianOkinawanOsageOttawaPaiutePakistaniPalestinianPanamanianParaguayanPennsylvania GermanPeruvianPimaPolishPortuguesePotawatomiPuebloPuerto RicanPuget Sound SalishRomanianRussianSalvadoranSamoanScandinavianScotch-IrishScottishSeminoleSenegaleseSerbianShoshoneSierra LeoneanSiouxSlavicSlovakSloveneSomaliSouth AfricanSouth AmericanSouth American IndianSoviet UnionSpaniardSpanishSpanish AmericanSpanish American IndianSri LankanSubsaharan AfricanSudaneseSwedishSwissSyrianTaiwaneseThaiTlingit-HaidaTohono O'OdhamTonganTrinidadian and TobagonianTsimshianTurkishU.S. Virgin IslanderUgandanUkrainianUruguayanUteVenezuelanVietnameseWelshWest IndianYakamaYaquiYugoslavianYumanYup'ikZimbabwean
Immigration
NonimmigrantsImmigrantsAfghanistanAfricaAlbaniaArgentinaArmeniaAsiaAustraliaAustriaBahamasBangladeshBarbadosBelarusBelgiumBelizeBoliviaBosnia and HerzegovinaBrazilBulgariaBurma/MyanmarCabo VerdeCambodiaCameroonCanadaCaribbeanCentral AmericaChileChinaColombiaCongoCosta RicaCroatiaCubaCzechoslovakiaDenmarkDominicaDominican RepublicEastern AfricaEastern AsiaEcuadorEgyptEl SalvadorEnglandEritreaEthiopiaEuropeFijiFranceGermanyGhanaGreeceGrenadaGuatemalaGuyanaHaitiHondurasHong KongHungaryIndiaIndonesiaIranIraqIrelandIsraelItalyJamaicaJapanJordanKazakhstanKenyaKoreaKuwaitLaosLatin AmericaLatviaLebanonLiberiaLithuaniaMalaysiaMexicoMicronesiaMiddle AfricaMoldovaMoroccoNepalNetherlandsNicaraguaNigeriaNorth AmericaNorth MacedoniaNorthern AfricaNorthern EuropeNorwayOceaniaPakistanPanamaPeruPhilippinesPolandPortugalRomaniaRussiaSaudi ArabiaScotlandSenegalSerbiaSierra LeoneSingaporeSomaliaSouth AfricaSouth AmericaSouth Central AsiaSouth Eastern AsiaSouthern EuropeSpainSri LankaSt. Vincent and the GrenadinesSudanSwedenSwitzerlandSyriaTaiwanThailandTrinidad and TobagoTurkeyUgandaUkraineUruguayUzbekistanVenezuelaVietnamWest IndiesWestern AfricaWestern AsiaWestern EuropeYemenZaireZimbabweAzores
Unemployment Among Ages 25 to 29 years
Income
Poverty
Unemployment
Labor Participation
Family Structure
Vehicle Availability
Education Level
Disability

Unemployment Among Ages 25 to 29 years Comparison

Immigrants from Eastern Europe

Immigrants from China

Exceptional
Exceptional
6.4%
UNEMPLOYMENT AMONG AGES 25 TO 29 YEARS
91.9/ 100
METRIC RATING
97th/ 347
METRIC RANK
6.2%
UNEMPLOYMENT AMONG AGES 25 TO 29 YEARS
98.1/ 100
METRIC RATING
62nd/ 347
METRIC RANK

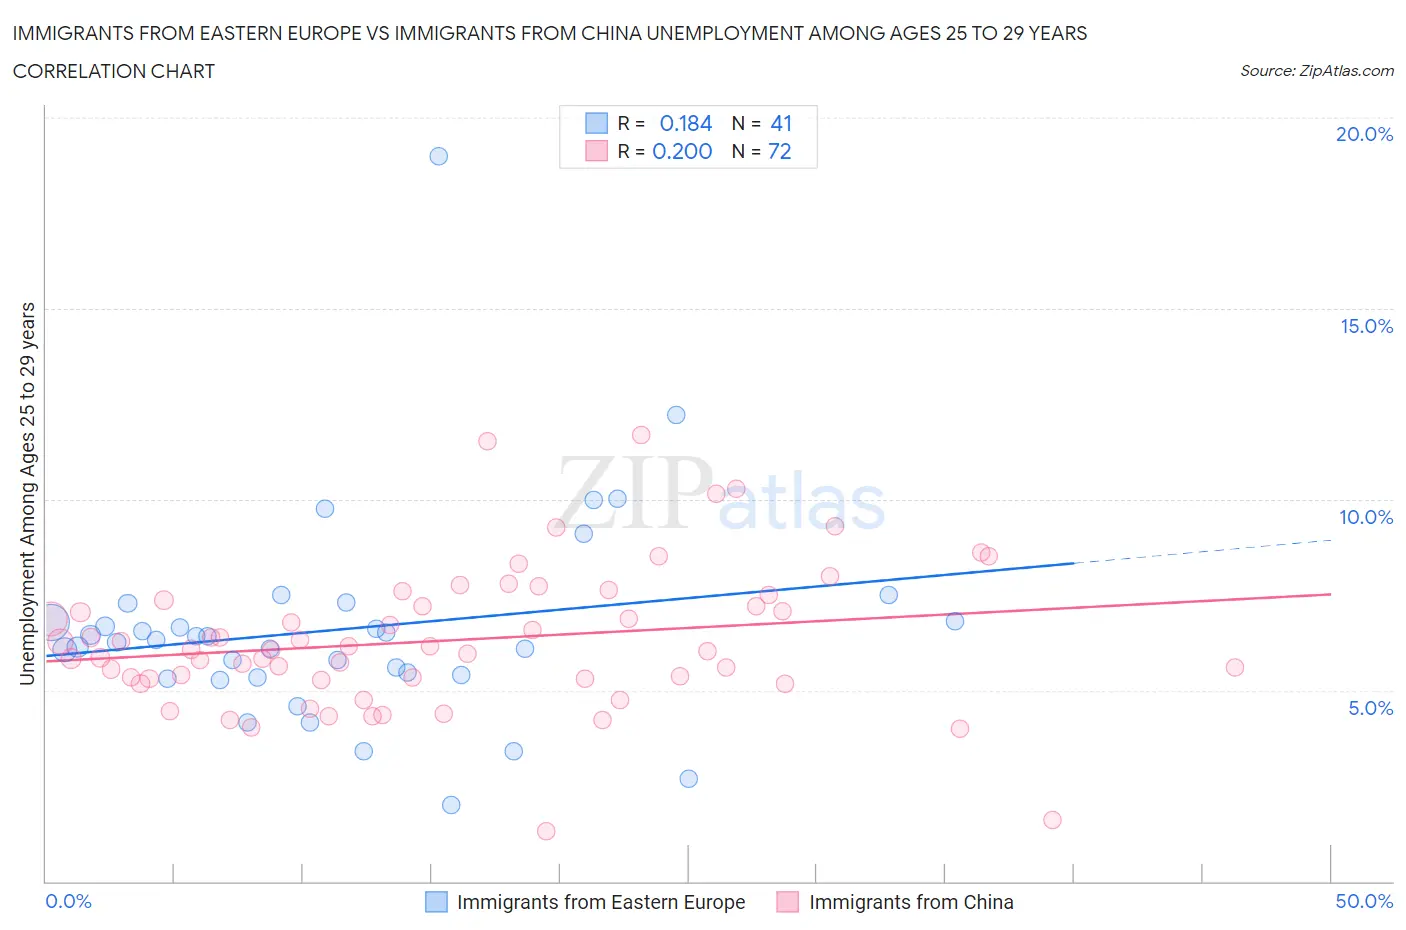
Immigrants from Eastern Europe vs Immigrants from China Unemployment Among Ages 25 to 29 years Correlation Chart

The statistical analysis conducted on geographies consisting of 442,415,438 people shows a poor positive correlation between the proportion of Immigrants from Eastern Europe and unemployment rate among population between the ages 25 and 29 in the United States with a correlation coefficient (R) of 0.184 and weighted average of 6.4%. Similarly, the statistical analysis conducted on geographies consisting of 429,685,796 people shows a poor positive correlation between the proportion of Immigrants from China and unemployment rate among population between the ages 25 and 29 in the United States with a correlation coefficient (R) of 0.200 and weighted average of 6.2%, a difference of 2.5%.
Immigrants from Eastern Europe vs Immigrants from China Unemployment Among Ages 25 to 29 years

Unemployment Among Ages 25 to 29 years Correlation Summary

MeasurementImmigrants from Eastern EuropeImmigrants from China
Minimum2.0%1.3%
Maximum19.0%11.7%
Range17.0%10.4%
Mean6.6%6.3%
Median6.3%6.1%
Interquartile 25% (IQ1)5.4%5.3%
Interquartile 75% (IQ3)7.0%7.3%
Interquartile Range (IQR)1.7%2.0%
Standard Deviation (Sample)2.8%1.9%
Standard Deviation (Population)2.8%1.9%

Similar Demographics by Unemployment Among Ages 25 to 29 years

Demographics Similar to Immigrants from Eastern Europe by Unemployment Among Ages 25 to 29 years

In terms of unemployment among ages 25 to 29 years, the demographic groups most similar to Immigrants from Eastern Europe are Serbian (6.4%, a difference of 0.030%), Immigrants from Brazil (6.4%, a difference of 0.060%), Iraqi (6.4%, a difference of 0.11%), Afghan (6.4%, a difference of 0.14%), and Uruguayan (6.4%, a difference of 0.14%).
DemographicsRating | RankUnemployment Among Ages 25 to 29 years
Lebanese
93.9
/100
|
#90
Exceptional
6.4%
Egyptians
93.9
/100
|
#91
Exceptional
6.4%
Immigrants | North Macedonia
93.6
/100
|
#92
Exceptional
6.4%
Australians
93.6
/100
|
#93
Exceptional
6.4%
Zimbabweans
93.5
/100
|
#94
Exceptional
6.4%
Afghans
92.5
/100
|
#95
Exceptional
6.4%
Immigrants | Brazil
92.1
/100
|
#96
Exceptional
6.4%
Immigrants | Eastern Europe
91.9
/100
|
#97
Exceptional
6.4%
Serbians
91.7
/100
|
#98
Exceptional
6.4%
Iraqis
91.3
/100
|
#99
Exceptional
6.4%
Uruguayans
91.2
/100
|
#100
Exceptional
6.4%
Immigrants | Ireland
91.1
/100
|
#101
Exceptional
6.4%
British
90.5
/100
|
#102
Exceptional
6.4%
Immigrants | Congo
90.4
/100
|
#103
Exceptional
6.4%
Cypriots
90.1
/100
|
#104
Exceptional
6.4%

Demographics Similar to Immigrants from China by Unemployment Among Ages 25 to 29 years

In terms of unemployment among ages 25 to 29 years, the demographic groups most similar to Immigrants from China are Kenyan (6.3%, a difference of 0.070%), Bhutanese (6.2%, a difference of 0.10%), Immigrants from Sri Lanka (6.3%, a difference of 0.12%), Immigrants from Lebanon (6.3%, a difference of 0.18%), and Indian (Asian) (6.3%, a difference of 0.19%).
DemographicsRating | RankUnemployment Among Ages 25 to 29 years
Immigrants | Netherlands
98.7
/100
|
#55
Exceptional
6.2%
Immigrants | Burma/Myanmar
98.7
/100
|
#56
Exceptional
6.2%
Immigrants | Saudi Arabia
98.6
/100
|
#57
Exceptional
6.2%
Immigrants | Eastern Asia
98.4
/100
|
#58
Exceptional
6.2%
Luxembourgers
98.3
/100
|
#59
Exceptional
6.2%
Immigrants | Taiwan
98.3
/100
|
#60
Exceptional
6.2%
Bhutanese
98.2
/100
|
#61
Exceptional
6.2%
Immigrants | China
98.1
/100
|
#62
Exceptional
6.2%
Kenyans
98.0
/100
|
#63
Exceptional
6.3%
Immigrants | Sri Lanka
97.9
/100
|
#64
Exceptional
6.3%
Immigrants | Lebanon
97.8
/100
|
#65
Exceptional
6.3%
Indians (Asian)
97.8
/100
|
#66
Exceptional
6.3%
Immigrants | Northern Africa
97.8
/100
|
#67
Exceptional
6.3%
Palestinians
97.7
/100
|
#68
Exceptional
6.3%
Immigrants | Hong Kong
97.5
/100
|
#69
Exceptional
6.3%