Immigrants from Eastern Asia vs Macedonian Unemployment Among Ages 65 to 74 years

COMPARE

Immigrants from Eastern Asia
Race
Ancestry
AfghanAfricanAlaska NativeAlaskan AthabascanAlbanianAleutAlsatianAmericanApacheArabArapahoArgentineanArmenianAssyrian/Chaldean/SyriacAustralianAustrianBahamianBangladeshiBarbadianBasqueBelgianBelizeanBermudanBhutaneseBlackfeetBolivianBrazilianBritishBritish West IndianBulgarianBurmeseCajunCambodianCanadianCape VerdeanCarpatho RusynCelticCentral AmericanCentral American IndianCherokeeCheyenneChickasawChileanChineseChippewaChoctawColombianColvilleComancheCosta RicanCreeCreekCroatianCrowCubanCypriotCzechCzechoslovakianDanishDelawareDominicanDutchDutch West IndianEastern EuropeanEcuadorianEgyptianEnglishEstonianEthiopianEuropeanFijianFilipinoFinnishFrenchFrench American IndianFrench CanadianGermanGerman RussianGhanaianGreekGuamanian/ChamorroGuatemalanGuyaneseHaitianHmongHonduranHopiHoumaHungarianIcelanderIndian (Asian)IndonesianInupiatIranianIraqiIrishIroquoisIsraeliItalianJamaicanJapaneseJordanianKenyanKiowaKoreanLaotianLatvianLebaneseLiberianLithuanianLumbeeLuxembourgerMalaysianMalteseMarshalleseMenomineeMexicanMexican American IndianMongolianMoroccanNative HawaiianNavajoNepaleseNew ZealanderNicaraguanNigerianNorthern EuropeanNorwegianOkinawanOsageOttawaPaiutePakistaniPalestinianPanamanianParaguayanPennsylvania GermanPeruvianPimaPolishPortuguesePotawatomiPuebloPuerto RicanPuget Sound SalishRomanianRussianSalvadoranSamoanScandinavianScotch-IrishScottishSeminoleSenegaleseSerbianShoshoneSierra LeoneanSiouxSlavicSlovakSloveneSomaliSouth AfricanSouth AmericanSouth American IndianSoviet UnionSpaniardSpanishSpanish AmericanSpanish American IndianSri LankanSubsaharan AfricanSudaneseSwedishSwissSyrianTaiwaneseThaiTlingit-HaidaTohono O'OdhamTonganTrinidadian and TobagonianTsimshianTurkishU.S. Virgin IslanderUgandanUkrainianUruguayanUteVenezuelanVietnameseWelshWest IndianYakamaYaquiYugoslavianYumanYup'ikZimbabwean
Immigration
NonimmigrantsImmigrantsAfghanistanAfricaAlbaniaArgentinaArmeniaAsiaAustraliaAustriaBahamasBangladeshBarbadosBelarusBelgiumBelizeBoliviaBosnia and HerzegovinaBrazilBulgariaBurma/MyanmarCabo VerdeCambodiaCameroonCanadaCaribbeanCentral AmericaChileChinaColombiaCongoCosta RicaCroatiaCubaCzechoslovakiaDenmarkDominicaDominican RepublicEastern AfricaEastern AsiaEastern EuropeEcuadorEgyptEl SalvadorEnglandEritreaEthiopiaEuropeFijiFranceGermanyGhanaGreeceGrenadaGuatemalaGuyanaHaitiHondurasHong KongHungaryIndiaIndonesiaIranIraqIrelandIsraelItalyJamaicaJapanJordanKazakhstanKenyaKoreaKuwaitLaosLatin AmericaLatviaLebanonLiberiaLithuaniaMalaysiaMexicoMicronesiaMiddle AfricaMoldovaMoroccoNepalNetherlandsNicaraguaNigeriaNorth AmericaNorth MacedoniaNorthern AfricaNorthern EuropeNorwayOceaniaPakistanPanamaPeruPhilippinesPolandPortugalRomaniaRussiaSaudi ArabiaScotlandSenegalSerbiaSierra LeoneSingaporeSomaliaSouth AfricaSouth AmericaSouth Central AsiaSouth Eastern AsiaSouthern EuropeSpainSri LankaSt. Vincent and the GrenadinesSudanSwedenSwitzerlandSyriaTaiwanThailandTrinidad and TobagoTurkeyUgandaUkraineUruguayUzbekistanVenezuelaVietnamWest IndiesWestern AfricaWestern AsiaWestern EuropeYemenZaireZimbabweAzores
Macedonian
Race
Ancestry
AfghanAfricanAlaska NativeAlaskan AthabascanAlbanianAleutAlsatianAmericanApacheArabArapahoArgentineanArmenianAssyrian/Chaldean/SyriacAustralianAustrianBahamianBangladeshiBarbadianBasqueBelgianBelizeanBermudanBhutaneseBlackfeetBolivianBrazilianBritishBritish West IndianBulgarianBurmeseCajunCambodianCanadianCape VerdeanCarpatho RusynCelticCentral AmericanCentral American IndianCherokeeCheyenneChickasawChileanChineseChippewaChoctawColombianColvilleComancheCosta RicanCreeCreekCroatianCrowCubanCypriotCzechCzechoslovakianDanishDelawareDominicanDutchDutch West IndianEastern EuropeanEcuadorianEgyptianEnglishEstonianEthiopianEuropeanFijianFilipinoFinnishFrenchFrench American IndianFrench CanadianGermanGerman RussianGhanaianGreekGuamanian/ChamorroGuatemalanGuyaneseHaitianHmongHonduranHopiHoumaHungarianIcelanderIndian (Asian)IndonesianInupiatIranianIraqiIrishIroquoisIsraeliItalianJamaicanJapaneseJordanianKenyanKiowaKoreanLaotianLatvianLebaneseLiberianLithuanianLumbeeLuxembourgerMacedonianMalaysianMalteseMarshalleseMenomineeMexicanMexican American IndianMongolianMoroccanNative HawaiianNavajoNepaleseNew ZealanderNicaraguanNigerianNorthern EuropeanNorwegianOkinawanOsageOttawaPaiutePakistaniPalestinianPanamanianParaguayanPennsylvania GermanPeruvianPimaPolishPortuguesePotawatomiPuebloPuerto RicanPuget Sound SalishRomanianRussianSalvadoranSamoanScandinavianScotch-IrishScottishSeminoleSenegaleseSerbianShoshoneSierra LeoneanSiouxSlavicSlovakSloveneSomaliSouth AfricanSouth AmericanSouth American IndianSoviet UnionSpaniardSpanishSpanish AmericanSpanish American IndianSri LankanSubsaharan AfricanSudaneseSwedishSwissSyrianTaiwaneseThaiTlingit-HaidaTohono O'OdhamTonganTrinidadian and TobagonianTsimshianTurkishU.S. Virgin IslanderUgandanUkrainianUruguayanUteVenezuelanVietnameseWelshWest IndianYakamaYaquiYugoslavianYumanYup'ikZimbabwean
Immigration
NonimmigrantsImmigrantsAfghanistanAfricaAlbaniaArgentinaArmeniaAsiaAustraliaAustriaBahamasBangladeshBarbadosBelarusBelgiumBelizeBoliviaBosnia and HerzegovinaBrazilBulgariaBurma/MyanmarCabo VerdeCambodiaCameroonCanadaCaribbeanCentral AmericaChileChinaColombiaCongoCosta RicaCroatiaCubaCzechoslovakiaDenmarkDominicaDominican RepublicEastern AfricaEastern EuropeEcuadorEgyptEl SalvadorEnglandEritreaEthiopiaEuropeFijiFranceGermanyGhanaGreeceGrenadaGuatemalaGuyanaHaitiHondurasHong KongHungaryIndiaIndonesiaIranIraqIrelandIsraelItalyJamaicaJapanJordanKazakhstanKenyaKoreaKuwaitLaosLatin AmericaLatviaLebanonLiberiaLithuaniaMalaysiaMexicoMicronesiaMiddle AfricaMoldovaMoroccoNepalNetherlandsNicaraguaNigeriaNorth AmericaNorth MacedoniaNorthern AfricaNorthern EuropeNorwayOceaniaPakistanPanamaPeruPhilippinesPolandPortugalRomaniaRussiaSaudi ArabiaScotlandSenegalSerbiaSierra LeoneSingaporeSomaliaSouth AfricaSouth AmericaSouth Central AsiaSouth Eastern AsiaSouthern EuropeSpainSri LankaSt. Vincent and the GrenadinesSudanSwedenSwitzerlandSyriaTaiwanThailandTrinidad and TobagoTurkeyUgandaUkraineUruguayUzbekistanVenezuelaVietnamWest IndiesWestern AfricaWestern AsiaWestern EuropeYemenZaireZimbabweAzores
Unemployment Among Ages 65 to 74 years
Income
Poverty
Unemployment
Labor Participation
Family Structure
Vehicle Availability
Education Level
Disability

Unemployment Among Ages 65 to 74 years Comparison

Immigrants from Eastern Asia

Macedonians

Good
Exceptional
5.3%
UNEMPLOYMENT AMONG AGES 65 TO 74 YEARS
62.5/ 100
METRIC RATING
162nd/ 347
METRIC RANK
5.0%
UNEMPLOYMENT AMONG AGES 65 TO 74 YEARS
100.0/ 100
METRIC RATING
25th/ 347
METRIC RANK

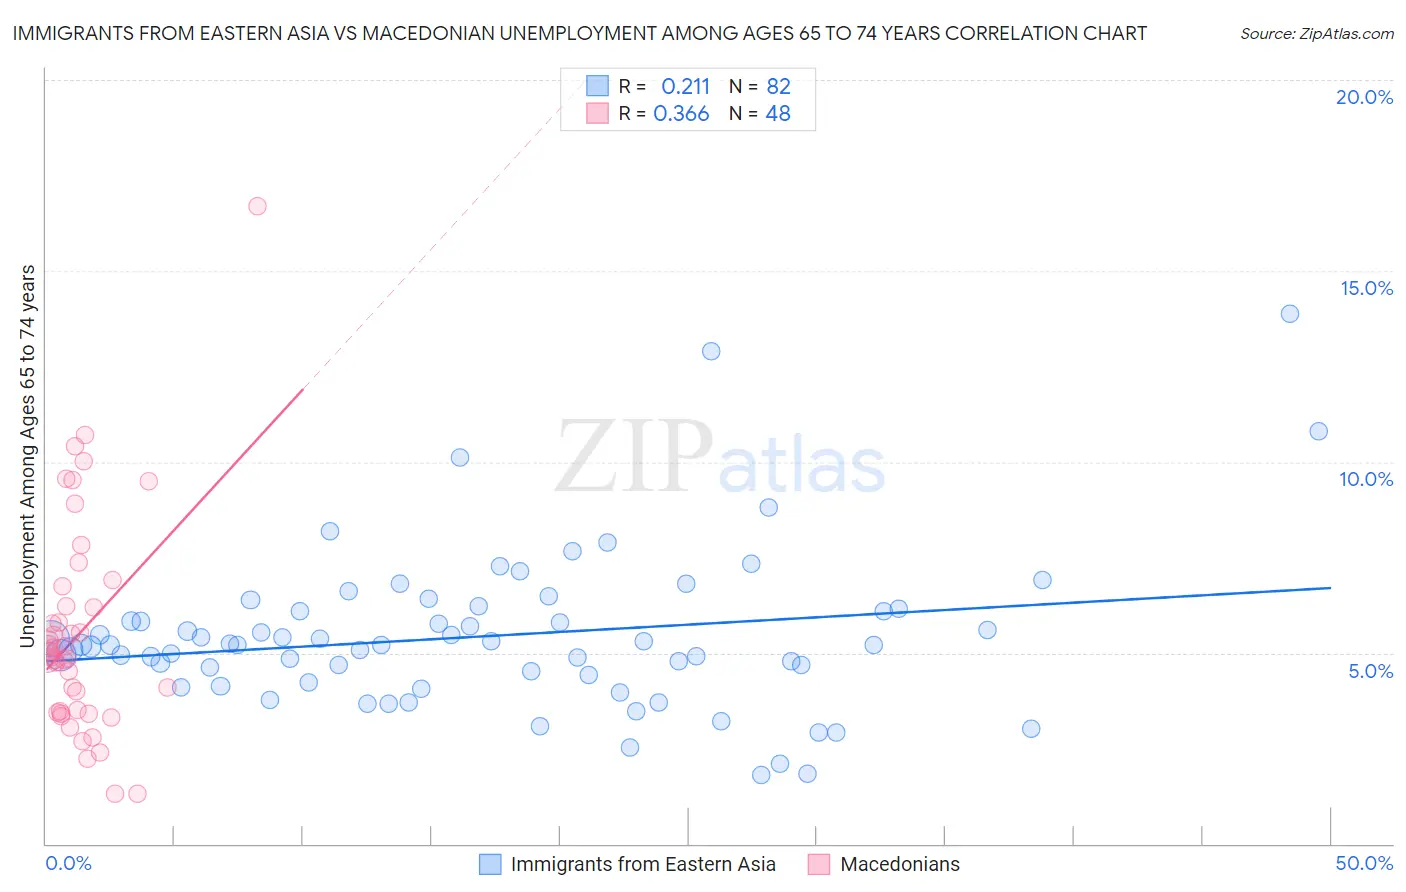
Immigrants from Eastern Asia vs Macedonian Unemployment Among Ages 65 to 74 years Correlation Chart

The statistical analysis conducted on geographies consisting of 418,674,579 people shows a weak positive correlation between the proportion of Immigrants from Eastern Asia and unemployment rate among population between the ages 65 and 74 in the United States with a correlation coefficient (R) of 0.211 and weighted average of 5.3%. Similarly, the statistical analysis conducted on geographies consisting of 123,972,473 people shows a mild positive correlation between the proportion of Macedonians and unemployment rate among population between the ages 65 and 74 in the United States with a correlation coefficient (R) of 0.366 and weighted average of 5.0%, a difference of 7.9%.
Immigrants from Eastern Asia vs Macedonian Unemployment Among Ages 65 to 74 years

Unemployment Among Ages 65 to 74 years Correlation Summary

MeasurementImmigrants from Eastern AsiaMacedonian
Minimum1.8%1.3%
Maximum13.9%16.7%
Range12.1%15.4%
Mean5.4%5.5%
Median5.2%5.0%
Interquartile 25% (IQ1)4.4%3.4%
Interquartile 75% (IQ3)6.1%6.5%
Interquartile Range (IQR)1.7%3.0%
Standard Deviation (Sample)2.1%2.9%
Standard Deviation (Population)2.0%2.8%

Similar Demographics by Unemployment Among Ages 65 to 74 years

Demographics Similar to Immigrants from Eastern Asia by Unemployment Among Ages 65 to 74 years

In terms of unemployment among ages 65 to 74 years, the demographic groups most similar to Immigrants from Eastern Asia are Mongolian (5.3%, a difference of 0.010%), Immigrants from Italy (5.3%, a difference of 0.040%), Immigrants from Philippines (5.3%, a difference of 0.050%), Immigrants from Bosnia and Herzegovina (5.3%, a difference of 0.080%), and Slovak (5.3%, a difference of 0.090%).
DemographicsRating | RankUnemployment Among Ages 65 to 74 years
Immigrants | Cameroon
72.1
/100
|
#155
Good
5.3%
Dutch
72.0
/100
|
#156
Good
5.3%
Immigrants | Eastern Europe
71.5
/100
|
#157
Good
5.3%
Immigrants | France
71.0
/100
|
#158
Good
5.3%
Immigrants | Czechoslovakia
66.3
/100
|
#159
Good
5.3%
Bangladeshis
65.8
/100
|
#160
Good
5.3%
Immigrants | Italy
63.7
/100
|
#161
Good
5.3%
Immigrants | Eastern Asia
62.5
/100
|
#162
Good
5.3%
Mongolians
62.3
/100
|
#163
Good
5.3%
Immigrants | Philippines
61.2
/100
|
#164
Good
5.3%
Immigrants | Bosnia and Herzegovina
60.2
/100
|
#165
Good
5.3%
Slovaks
60.0
/100
|
#166
Good
5.3%
Indians (Asian)
59.9
/100
|
#167
Average
5.3%
Whites/Caucasians
57.2
/100
|
#168
Average
5.4%
Laotians
55.7
/100
|
#169
Average
5.4%

Demographics Similar to Macedonians by Unemployment Among Ages 65 to 74 years

In terms of unemployment among ages 65 to 74 years, the demographic groups most similar to Macedonians are Czech (5.0%, a difference of 0.050%), Norwegian (5.0%, a difference of 0.24%), Bulgarian (5.0%, a difference of 0.34%), Iraqi (4.9%, a difference of 0.56%), and Immigrants from Nepal (4.9%, a difference of 0.77%).
DemographicsRating | RankUnemployment Among Ages 65 to 74 years
Creek
100.0
/100
|
#18
Exceptional
4.8%
Menominee
100.0
/100
|
#19
Exceptional
4.8%
Immigrants | Zaire
100.0
/100
|
#20
Exceptional
4.8%
Immigrants | Eritrea
100.0
/100
|
#21
Exceptional
4.9%
Lebanese
100.0
/100
|
#22
Exceptional
4.9%
Immigrants | Nepal
100.0
/100
|
#23
Exceptional
4.9%
Iraqis
100.0
/100
|
#24
Exceptional
4.9%
Macedonians
100.0
/100
|
#25
Exceptional
5.0%
Czechs
100.0
/100
|
#26
Exceptional
5.0%
Norwegians
100.0
/100
|
#27
Exceptional
5.0%
Bulgarians
100.0
/100
|
#28
Exceptional
5.0%
Ethiopians
100.0
/100
|
#29
Exceptional
5.0%
Immigrants | Lebanon
100.0
/100
|
#30
Exceptional
5.0%
Slovenes
100.0
/100
|
#31
Exceptional
5.0%
Palestinians
100.0
/100
|
#32
Exceptional
5.0%