Immigrants from Eastern Asia vs Immigrants from Guatemala Unemployment Among Ages 20 to 24 years
COMPARE
Immigrants from Eastern Asia
Immigrants from Guatemala
Unemployment Among Ages 20 to 24 years
Unemployment Among Ages 20 to 24 years Comparison
Immigrants from Eastern Asia
Immigrants from Guatemala
10.3%
UNEMPLOYMENT AMONG AGES 20 TO 24 YEARS
52.7/ 100
METRIC RATING
171st/ 347
METRIC RANK
10.5%
UNEMPLOYMENT AMONG AGES 20 TO 24 YEARS
14.6/ 100
METRIC RATING
211th/ 347
METRIC RANK
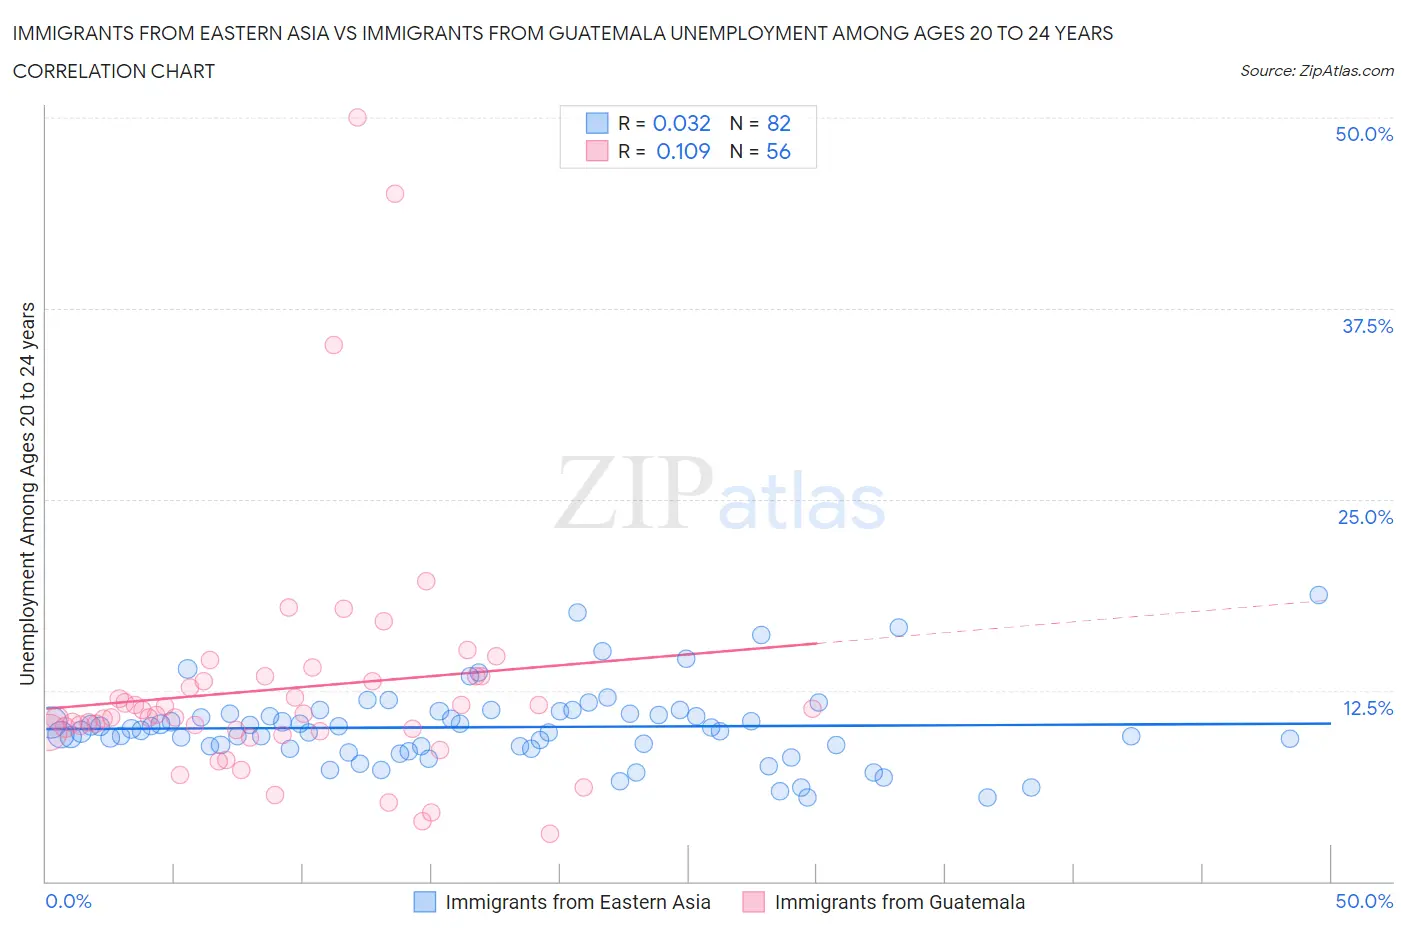
Immigrants from Eastern Asia vs Immigrants from Guatemala Unemployment Among Ages 20 to 24 years Correlation Chart
The statistical analysis conducted on geographies consisting of 475,626,632 people shows no correlation between the proportion of Immigrants from Eastern Asia and unemployment rate among population between the ages 20 and 24 in the United States with a correlation coefficient (R) of 0.032 and weighted average of 10.3%. Similarly, the statistical analysis conducted on geographies consisting of 367,875,479 people shows a poor positive correlation between the proportion of Immigrants from Guatemala and unemployment rate among population between the ages 20 and 24 in the United States with a correlation coefficient (R) of 0.109 and weighted average of 10.5%, a difference of 1.7%.
Unemployment Among Ages 20 to 24 years Correlation Summary
| Measurement | Immigrants from Eastern Asia | Immigrants from Guatemala |
| Minimum | 5.5% | 3.1% |
| Maximum | 18.7% | 50.0% |
| Range | 13.2% | 46.9% |
| Mean | 10.1% | 12.6% |
| Median | 9.9% | 10.8% |
| Interquartile 25% (IQ1) | 8.8% | 9.8% |
| Interquartile 75% (IQ3) | 11.0% | 13.3% |
| Interquartile Range (IQR) | 2.2% | 3.5% |
| Standard Deviation (Sample) | 2.5% | 8.2% |
| Standard Deviation (Population) | 2.5% | 8.1% |
Similar Demographics by Unemployment Among Ages 20 to 24 years
Demographics Similar to Immigrants from Eastern Asia by Unemployment Among Ages 20 to 24 years
In terms of unemployment among ages 20 to 24 years, the demographic groups most similar to Immigrants from Eastern Asia are Korean (10.3%, a difference of 0.030%), Immigrants from Sweden (10.3%, a difference of 0.070%), Turkish (10.3%, a difference of 0.090%), Ukrainian (10.3%, a difference of 0.10%), and Immigrants from Colombia (10.3%, a difference of 0.13%).
| Demographics | Rating | Rank | Unemployment Among Ages 20 to 24 years |
| Immigrants | Korea | 59.0 /100 | #164 | Average 10.3% |
| Lebanese | 58.3 /100 | #165 | Average 10.3% |
| Italians | 57.7 /100 | #166 | Average 10.3% |
| Immigrants | Fiji | 57.6 /100 | #167 | Average 10.3% |
| Iraqis | 56.7 /100 | #168 | Average 10.3% |
| Immigrants | Colombia | 56.3 /100 | #169 | Average 10.3% |
| Turks | 55.2 /100 | #170 | Average 10.3% |
| Immigrants | Eastern Asia | 52.7 /100 | #171 | Average 10.3% |
| Koreans | 51.9 /100 | #172 | Average 10.3% |
| Immigrants | Sweden | 50.8 /100 | #173 | Average 10.3% |
| Ukrainians | 50.0 /100 | #174 | Average 10.3% |
| Samoans | 45.4 /100 | #175 | Average 10.3% |
| Potawatomi | 42.0 /100 | #176 | Average 10.3% |
| Immigrants | Czechoslovakia | 40.8 /100 | #177 | Average 10.3% |
| Alsatians | 40.5 /100 | #178 | Average 10.3% |
Demographics Similar to Immigrants from Guatemala by Unemployment Among Ages 20 to 24 years
In terms of unemployment among ages 20 to 24 years, the demographic groups most similar to Immigrants from Guatemala are Immigrants from Sri Lanka (10.5%, a difference of 0.040%), Immigrants from Belgium (10.5%, a difference of 0.16%), Peruvian (10.5%, a difference of 0.17%), Guatemalan (10.5%, a difference of 0.19%), and Immigrants from Hong Kong (10.5%, a difference of 0.20%).
| Demographics | Rating | Rank | Unemployment Among Ages 20 to 24 years |
| Immigrants | Northern Europe | 19.5 /100 | #204 | Poor 10.4% |
| Cypriots | 18.9 /100 | #205 | Poor 10.4% |
| Immigrants | Europe | 18.5 /100 | #206 | Poor 10.4% |
| Immigrants | Honduras | 17.9 /100 | #207 | Poor 10.4% |
| Immigrants | Hong Kong | 17.6 /100 | #208 | Poor 10.5% |
| Peruvians | 17.2 /100 | #209 | Poor 10.5% |
| Immigrants | Belgium | 16.9 /100 | #210 | Poor 10.5% |
| Immigrants | Guatemala | 14.6 /100 | #211 | Poor 10.5% |
| Immigrants | Sri Lanka | 14.0 /100 | #212 | Poor 10.5% |
| Guatemalans | 12.2 /100 | #213 | Poor 10.5% |
| Kiowa | 11.7 /100 | #214 | Poor 10.5% |
| Hondurans | 10.5 /100 | #215 | Poor 10.5% |
| Costa Ricans | 9.6 /100 | #216 | Tragic 10.5% |
| Cherokee | 9.3 /100 | #217 | Tragic 10.5% |
| Immigrants | Nonimmigrants | 8.8 /100 | #218 | Tragic 10.5% |