Immigrants from Eastern Africa vs Ecuadorian Unemployment Among Ages 25 to 29 years

COMPARE

Immigrants from Eastern Africa
Race
Ancestry
AfghanAfricanAlaska NativeAlaskan AthabascanAlbanianAleutAlsatianAmericanApacheArabArapahoArgentineanArmenianAssyrian/Chaldean/SyriacAustralianAustrianBahamianBangladeshiBarbadianBasqueBelgianBelizeanBermudanBhutaneseBlackfeetBolivianBrazilianBritishBritish West IndianBulgarianBurmeseCajunCambodianCanadianCape VerdeanCarpatho RusynCelticCentral AmericanCentral American IndianCherokeeCheyenneChickasawChileanChineseChippewaChoctawColombianColvilleComancheCosta RicanCreeCreekCroatianCrowCubanCypriotCzechCzechoslovakianDanishDelawareDominicanDutchDutch West IndianEastern EuropeanEgyptianEnglishEstonianEthiopianEuropeanFijianFilipinoFinnishFrenchFrench American IndianFrench CanadianGermanGerman RussianGhanaianGreekGuamanian/ChamorroGuatemalanGuyaneseHaitianHmongHonduranHopiHoumaHungarianIcelanderIndian (Asian)IndonesianInupiatIranianIraqiIrishIroquoisIsraeliItalianJamaicanJapaneseJordanianKenyanKiowaKoreanLaotianLatvianLebaneseLiberianLithuanianLumbeeLuxembourgerMacedonianMalaysianMalteseMarshalleseMenomineeMexicanMexican American IndianMongolianMoroccanNative HawaiianNavajoNepaleseNew ZealanderNicaraguanNigerianNorthern EuropeanNorwegianOkinawanOsageOttawaPaiutePakistaniPalestinianPanamanianParaguayanPennsylvania GermanPeruvianPimaPolishPortuguesePotawatomiPuebloPuerto RicanPuget Sound SalishRomanianRussianSalvadoranSamoanScandinavianScotch-IrishScottishSeminoleSenegaleseSerbianShoshoneSierra LeoneanSiouxSlavicSlovakSloveneSomaliSouth AfricanSouth AmericanSouth American IndianSoviet UnionSpaniardSpanishSpanish AmericanSpanish American IndianSri LankanSubsaharan AfricanSudaneseSwedishSwissSyrianTaiwaneseThaiTlingit-HaidaTohono O'OdhamTonganTrinidadian and TobagonianTsimshianTurkishU.S. Virgin IslanderUgandanUkrainianUruguayanUteVenezuelanVietnameseWelshWest IndianYakamaYaquiYugoslavianYumanYup'ikZimbabwean
Immigration
NonimmigrantsImmigrantsAfghanistanAfricaAlbaniaArgentinaArmeniaAsiaAustraliaAustriaBahamasBangladeshBarbadosBelarusBelgiumBelizeBoliviaBosnia and HerzegovinaBrazilBulgariaBurma/MyanmarCabo VerdeCambodiaCameroonCanadaCaribbeanCentral AmericaChileChinaColombiaCongoCosta RicaCroatiaCubaCzechoslovakiaDenmarkDominicaDominican RepublicEastern AfricaEastern AsiaEastern EuropeEcuadorEgyptEl SalvadorEnglandEritreaEthiopiaEuropeFijiFranceGermanyGhanaGreeceGrenadaGuatemalaGuyanaHaitiHondurasHong KongHungaryIndiaIndonesiaIranIraqIrelandIsraelItalyJamaicaJapanJordanKazakhstanKenyaKoreaKuwaitLaosLatin AmericaLatviaLebanonLiberiaLithuaniaMalaysiaMexicoMicronesiaMiddle AfricaMoldovaMoroccoNepalNetherlandsNicaraguaNigeriaNorth AmericaNorth MacedoniaNorthern AfricaNorthern EuropeNorwayOceaniaPakistanPanamaPeruPhilippinesPolandPortugalRomaniaRussiaSaudi ArabiaScotlandSenegalSerbiaSierra LeoneSingaporeSomaliaSouth AfricaSouth AmericaSouth Central AsiaSouth Eastern AsiaSouthern EuropeSpainSri LankaSt. Vincent and the GrenadinesSudanSwedenSwitzerlandSyriaTaiwanThailandTrinidad and TobagoTurkeyUgandaUkraineUruguayUzbekistanVenezuelaVietnamWest IndiesWestern AfricaWestern AsiaWestern EuropeYemenZaireZimbabweAzores
Ecuadorian
Race
Ancestry
AfghanAfricanAlaska NativeAlaskan AthabascanAlbanianAleutAlsatianAmericanApacheArabArapahoArgentineanArmenianAssyrian/Chaldean/SyriacAustralianAustrianBahamianBangladeshiBarbadianBasqueBelgianBelizeanBermudanBhutaneseBlackfeetBolivianBrazilianBritishBritish West IndianBulgarianBurmeseCajunCambodianCanadianCape VerdeanCarpatho RusynCelticCentral AmericanCentral American IndianCherokeeCheyenneChickasawChileanChineseChippewaChoctawColombianColvilleComancheCosta RicanCreeCreekCroatianCrowCubanCypriotCzechCzechoslovakianDanishDelawareDominicanDutchDutch West IndianEastern EuropeanEcuadorianEgyptianEnglishEstonianEthiopianEuropeanFijianFilipinoFinnishFrenchFrench American IndianFrench CanadianGermanGerman RussianGhanaianGreekGuamanian/ChamorroGuatemalanGuyaneseHaitianHmongHonduranHopiHoumaHungarianIcelanderIndian (Asian)IndonesianInupiatIranianIraqiIrishIroquoisIsraeliItalianJamaicanJapaneseJordanianKenyanKiowaKoreanLaotianLatvianLebaneseLiberianLithuanianLumbeeLuxembourgerMacedonianMalaysianMalteseMarshalleseMenomineeMexicanMexican American IndianMongolianMoroccanNative HawaiianNavajoNepaleseNew ZealanderNicaraguanNigerianNorthern EuropeanNorwegianOkinawanOsageOttawaPaiutePakistaniPalestinianPanamanianParaguayanPennsylvania GermanPeruvianPimaPolishPortuguesePotawatomiPuebloPuerto RicanPuget Sound SalishRomanianRussianSalvadoranSamoanScandinavianScotch-IrishScottishSeminoleSenegaleseSerbianShoshoneSierra LeoneanSiouxSlavicSlovakSloveneSomaliSouth AfricanSouth AmericanSouth American IndianSoviet UnionSpaniardSpanishSpanish AmericanSpanish American IndianSri LankanSubsaharan AfricanSudaneseSwedishSwissSyrianTaiwaneseThaiTlingit-HaidaTohono O'OdhamTonganTrinidadian and TobagonianTsimshianTurkishU.S. Virgin IslanderUgandanUkrainianUruguayanUteVenezuelanVietnameseWelshWest IndianYakamaYaquiYugoslavianYumanYup'ikZimbabwean
Immigration
NonimmigrantsImmigrantsAfghanistanAfricaAlbaniaArgentinaArmeniaAsiaAustraliaAustriaBahamasBangladeshBarbadosBelarusBelgiumBelizeBoliviaBosnia and HerzegovinaBrazilBulgariaBurma/MyanmarCabo VerdeCambodiaCameroonCanadaCaribbeanCentral AmericaChileChinaColombiaCongoCosta RicaCroatiaCubaCzechoslovakiaDenmarkDominicaDominican RepublicEastern AsiaEastern EuropeEcuadorEgyptEl SalvadorEnglandEritreaEthiopiaEuropeFijiFranceGermanyGhanaGreeceGrenadaGuatemalaGuyanaHaitiHondurasHong KongHungaryIndiaIndonesiaIranIraqIrelandIsraelItalyJamaicaJapanJordanKazakhstanKenyaKoreaKuwaitLaosLatin AmericaLatviaLebanonLiberiaLithuaniaMalaysiaMexicoMicronesiaMiddle AfricaMoldovaMoroccoNepalNetherlandsNicaraguaNigeriaNorth AmericaNorth MacedoniaNorthern AfricaNorthern EuropeNorwayOceaniaPakistanPanamaPeruPhilippinesPolandPortugalRomaniaRussiaSaudi ArabiaScotlandSenegalSerbiaSierra LeoneSingaporeSomaliaSouth AfricaSouth AmericaSouth Central AsiaSouth Eastern AsiaSouthern EuropeSpainSri LankaSt. Vincent and the GrenadinesSudanSwedenSwitzerlandSyriaTaiwanThailandTrinidad and TobagoTurkeyUgandaUkraineUruguayUzbekistanVenezuelaVietnamWest IndiesWestern AfricaWestern AsiaWestern EuropeYemenZaireZimbabweAzores
Unemployment Among Ages 25 to 29 years
Income
Poverty
Unemployment
Labor Participation
Family Structure
Vehicle Availability
Education Level
Disability

Unemployment Among Ages 25 to 29 years Comparison

Immigrants from Eastern Africa

Ecuadorians

Exceptional
Tragic
6.0%
UNEMPLOYMENT AMONG AGES 25 TO 29 YEARS
99.8/ 100
METRIC RATING
26th/ 347
METRIC RANK
7.4%
UNEMPLOYMENT AMONG AGES 25 TO 29 YEARS
0.1/ 100
METRIC RATING
262nd/ 347
METRIC RANK

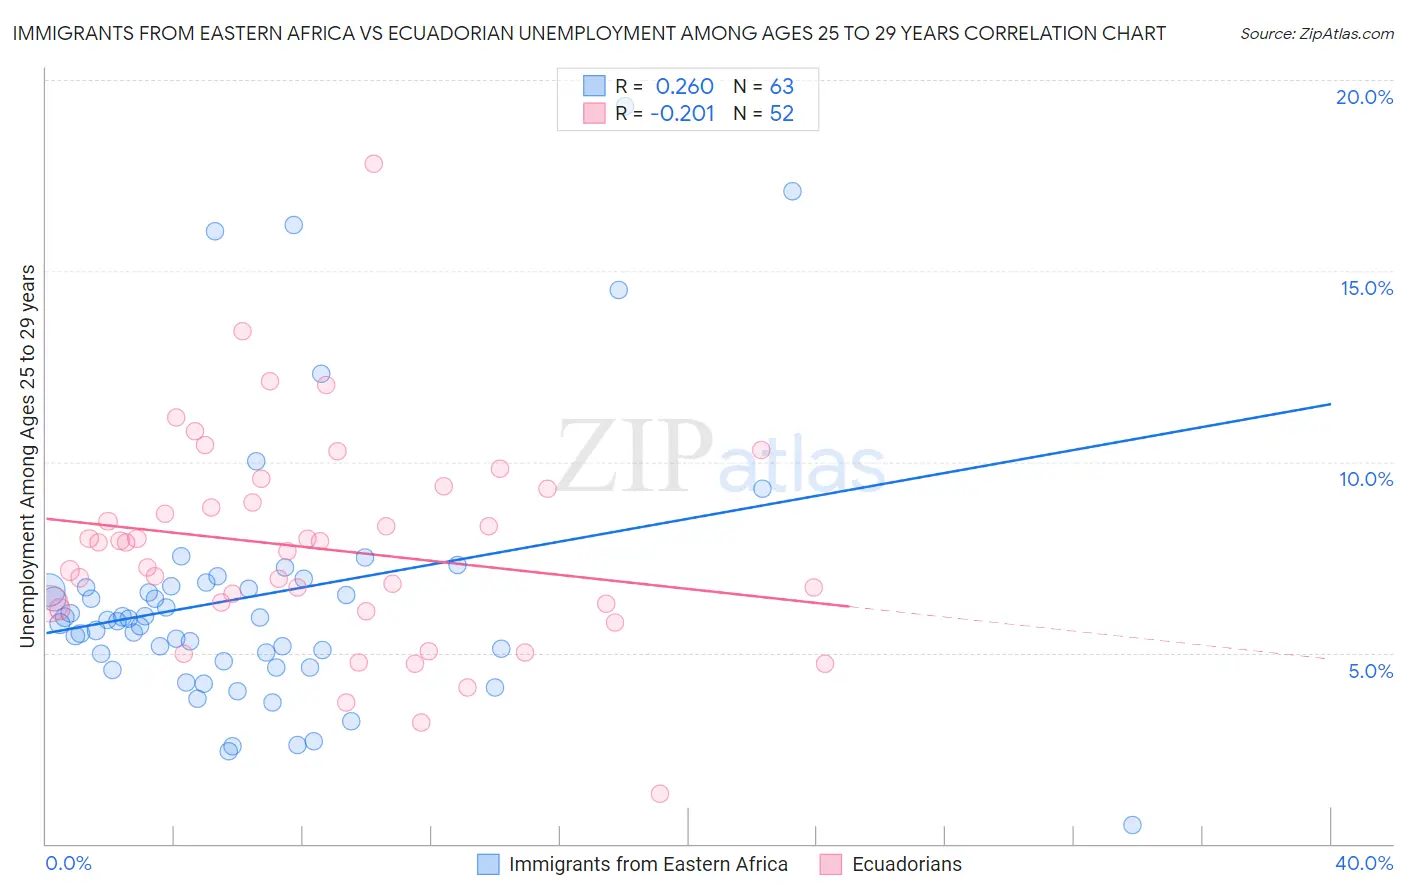
Immigrants from Eastern Africa vs Ecuadorian Unemployment Among Ages 25 to 29 years Correlation Chart

The statistical analysis conducted on geographies consisting of 342,295,039 people shows a weak positive correlation between the proportion of Immigrants from Eastern Africa and unemployment rate among population between the ages 25 and 29 in the United States with a correlation coefficient (R) of 0.260 and weighted average of 6.0%. Similarly, the statistical analysis conducted on geographies consisting of 307,503,017 people shows a weak negative correlation between the proportion of Ecuadorians and unemployment rate among population between the ages 25 and 29 in the United States with a correlation coefficient (R) of -0.201 and weighted average of 7.4%, a difference of 22.4%.
Immigrants from Eastern Africa vs Ecuadorian Unemployment Among Ages 25 to 29 years

Unemployment Among Ages 25 to 29 years Correlation Summary

MeasurementImmigrants from Eastern AfricaEcuadorian
Minimum0.50%1.3%
Maximum19.3%17.8%
Range18.8%16.5%
Mean6.5%7.7%
Median5.8%7.8%
Interquartile 25% (IQ1)4.8%6.2%
Interquartile 75% (IQ3)6.7%9.1%
Interquartile Range (IQR)1.9%2.9%
Standard Deviation (Sample)3.5%2.8%
Standard Deviation (Population)3.5%2.8%

Similar Demographics by Unemployment Among Ages 25 to 29 years

Demographics Similar to Immigrants from Eastern Africa by Unemployment Among Ages 25 to 29 years

In terms of unemployment among ages 25 to 29 years, the demographic groups most similar to Immigrants from Eastern Africa are New Zealander (6.0%, a difference of 0.070%), Immigrants from Zaire (6.0%, a difference of 0.12%), Danish (6.0%, a difference of 0.18%), Immigrants from South Central Asia (6.1%, a difference of 0.35%), and Bulgarian (6.1%, a difference of 0.46%).
DemographicsRating | RankUnemployment Among Ages 25 to 29 years
Thais
99.9
/100
|
#19
Exceptional
5.9%
Immigrants | Eritrea
99.9
/100
|
#20
Exceptional
5.9%
Immigrants | Ethiopia
99.9
/100
|
#21
Exceptional
6.0%
Immigrants | Japan
99.9
/100
|
#22
Exceptional
6.0%
Immigrants | Venezuela
99.8
/100
|
#23
Exceptional
6.0%
Norwegians
99.8
/100
|
#24
Exceptional
6.0%
New Zealanders
99.8
/100
|
#25
Exceptional
6.0%
Immigrants | Eastern Africa
99.8
/100
|
#26
Exceptional
6.0%
Immigrants | Zaire
99.7
/100
|
#27
Exceptional
6.0%
Danes
99.7
/100
|
#28
Exceptional
6.0%
Immigrants | South Central Asia
99.7
/100
|
#29
Exceptional
6.1%
Bulgarians
99.7
/100
|
#30
Exceptional
6.1%
Filipinos
99.7
/100
|
#31
Exceptional
6.1%
Chinese
99.6
/100
|
#32
Exceptional
6.1%
Yugoslavians
99.6
/100
|
#33
Exceptional
6.1%

Demographics Similar to Ecuadorians by Unemployment Among Ages 25 to 29 years

In terms of unemployment among ages 25 to 29 years, the demographic groups most similar to Ecuadorians are Nigerian (7.4%, a difference of 0.050%), Kiowa (7.4%, a difference of 0.080%), American (7.4%, a difference of 0.14%), Immigrants from Western Africa (7.4%, a difference of 0.17%), and Immigrants from Fiji (7.4%, a difference of 0.23%).
DemographicsRating | RankUnemployment Among Ages 25 to 29 years
Immigrants | Cameroon
0.3
/100
|
#255
Tragic
7.2%
Mexican American Indians
0.3
/100
|
#256
Tragic
7.3%
Assyrians/Chaldeans/Syriacs
0.2
/100
|
#257
Tragic
7.3%
Ottawa
0.1
/100
|
#258
Tragic
7.3%
Cree
0.1
/100
|
#259
Tragic
7.3%
Americans
0.1
/100
|
#260
Tragic
7.4%
Nigerians
0.1
/100
|
#261
Tragic
7.4%
Ecuadorians
0.1
/100
|
#262
Tragic
7.4%
Kiowa
0.1
/100
|
#263
Tragic
7.4%
Immigrants | Western Africa
0.1
/100
|
#264
Tragic
7.4%
Immigrants | Fiji
0.1
/100
|
#265
Tragic
7.4%
Paiute
0.1
/100
|
#266
Tragic
7.4%
Pennsylvania Germans
0.1
/100
|
#267
Tragic
7.4%
Immigrants | Ecuador
0.1
/100
|
#268
Tragic
7.4%
Immigrants | Latin America
0.1
/100
|
#269
Tragic
7.4%