Immigrants from Dominican Republic vs Potawatomi Unemployment Among Ages 16 to 19 years

COMPARE

Immigrants from Dominican Republic
Race
Ancestry
AfghanAfricanAlaska NativeAlaskan AthabascanAlbanianAleutAlsatianAmericanApacheArabArapahoArgentineanArmenianAssyrian/Chaldean/SyriacAustralianAustrianBahamianBangladeshiBarbadianBasqueBelgianBelizeanBermudanBhutaneseBlackfeetBolivianBrazilianBritishBritish West IndianBulgarianBurmeseCajunCambodianCanadianCape VerdeanCarpatho RusynCelticCentral AmericanCentral American IndianCherokeeCheyenneChickasawChileanChineseChippewaChoctawColombianColvilleComancheCosta RicanCreeCreekCroatianCrowCubanCypriotCzechCzechoslovakianDanishDelawareDominicanDutchDutch West IndianEastern EuropeanEcuadorianEgyptianEnglishEstonianEthiopianEuropeanFijianFilipinoFinnishFrenchFrench American IndianFrench CanadianGermanGerman RussianGhanaianGreekGuamanian/ChamorroGuatemalanGuyaneseHaitianHmongHonduranHopiHoumaHungarianIcelanderIndian (Asian)IndonesianInupiatIranianIraqiIrishIroquoisIsraeliItalianJamaicanJapaneseJordanianKenyanKiowaKoreanLaotianLatvianLebaneseLiberianLithuanianLumbeeLuxembourgerMacedonianMalaysianMalteseMarshalleseMenomineeMexicanMexican American IndianMongolianMoroccanNative HawaiianNavajoNepaleseNew ZealanderNicaraguanNigerianNorthern EuropeanNorwegianOkinawanOsageOttawaPaiutePakistaniPalestinianPanamanianParaguayanPennsylvania GermanPeruvianPimaPolishPortuguesePuebloPuerto RicanPuget Sound SalishRomanianRussianSalvadoranSamoanScandinavianScotch-IrishScottishSeminoleSenegaleseSerbianShoshoneSierra LeoneanSiouxSlavicSlovakSloveneSomaliSouth AfricanSouth AmericanSouth American IndianSoviet UnionSpaniardSpanishSpanish AmericanSpanish American IndianSri LankanSubsaharan AfricanSudaneseSwedishSwissSyrianTaiwaneseThaiTlingit-HaidaTohono O'OdhamTonganTrinidadian and TobagonianTsimshianTurkishU.S. Virgin IslanderUgandanUkrainianUruguayanUteVenezuelanVietnameseWelshWest IndianYakamaYaquiYugoslavianYumanYup'ikZimbabwean
Immigration
NonimmigrantsImmigrantsAfghanistanAfricaAlbaniaArgentinaArmeniaAsiaAustraliaAustriaBahamasBangladeshBarbadosBelarusBelgiumBelizeBoliviaBosnia and HerzegovinaBrazilBulgariaBurma/MyanmarCabo VerdeCambodiaCameroonCanadaCaribbeanCentral AmericaChileChinaColombiaCongoCosta RicaCroatiaCubaCzechoslovakiaDenmarkDominicaDominican RepublicEastern AfricaEastern AsiaEastern EuropeEcuadorEgyptEl SalvadorEnglandEritreaEthiopiaEuropeFijiFranceGermanyGhanaGreeceGrenadaGuatemalaGuyanaHaitiHondurasHong KongHungaryIndiaIndonesiaIranIraqIrelandIsraelItalyJamaicaJapanJordanKazakhstanKenyaKoreaKuwaitLaosLatin AmericaLatviaLebanonLiberiaLithuaniaMalaysiaMexicoMicronesiaMiddle AfricaMoldovaMoroccoNepalNetherlandsNicaraguaNigeriaNorth AmericaNorth MacedoniaNorthern AfricaNorthern EuropeNorwayOceaniaPakistanPanamaPeruPhilippinesPolandPortugalRomaniaRussiaSaudi ArabiaScotlandSenegalSerbiaSierra LeoneSingaporeSomaliaSouth AfricaSouth AmericaSouth Central AsiaSouth Eastern AsiaSouthern EuropeSpainSri LankaSt. Vincent and the GrenadinesSudanSwedenSwitzerlandSyriaTaiwanThailandTrinidad and TobagoTurkeyUgandaUkraineUruguayUzbekistanVenezuelaVietnamWest IndiesWestern AfricaWestern AsiaWestern EuropeYemenZaireZimbabweAzores
Potawatomi
Race
Ancestry
AfghanAfricanAlaska NativeAlaskan AthabascanAlbanianAleutAlsatianAmericanApacheArabArapahoArgentineanArmenianAssyrian/Chaldean/SyriacAustralianAustrianBahamianBangladeshiBarbadianBasqueBelgianBelizeanBermudanBhutaneseBlackfeetBolivianBrazilianBritishBritish West IndianBulgarianBurmeseCajunCambodianCanadianCape VerdeanCarpatho RusynCelticCentral AmericanCentral American IndianCherokeeCheyenneChickasawChileanChineseChippewaChoctawColombianColvilleComancheCosta RicanCreeCreekCroatianCrowCubanCypriotCzechCzechoslovakianDanishDelawareDominicanDutchDutch West IndianEastern EuropeanEcuadorianEgyptianEnglishEstonianEthiopianEuropeanFijianFilipinoFinnishFrenchFrench American IndianFrench CanadianGermanGerman RussianGhanaianGreekGuamanian/ChamorroGuatemalanGuyaneseHaitianHmongHonduranHopiHoumaHungarianIcelanderIndian (Asian)IndonesianInupiatIranianIraqiIrishIroquoisIsraeliItalianJamaicanJapaneseJordanianKenyanKiowaKoreanLaotianLatvianLebaneseLiberianLithuanianLumbeeLuxembourgerMacedonianMalaysianMalteseMarshalleseMenomineeMexicanMexican American IndianMongolianMoroccanNative HawaiianNavajoNepaleseNew ZealanderNicaraguanNigerianNorthern EuropeanNorwegianOkinawanOsageOttawaPaiutePakistaniPalestinianPanamanianParaguayanPennsylvania GermanPeruvianPimaPolishPortuguesePotawatomiPuebloPuerto RicanPuget Sound SalishRomanianRussianSalvadoranSamoanScandinavianScotch-IrishScottishSeminoleSenegaleseSerbianShoshoneSierra LeoneanSiouxSlavicSlovakSloveneSomaliSouth AfricanSouth AmericanSouth American IndianSoviet UnionSpaniardSpanishSpanish AmericanSpanish American IndianSri LankanSubsaharan AfricanSudaneseSwedishSwissSyrianTaiwaneseThaiTlingit-HaidaTohono O'OdhamTonganTrinidadian and TobagonianTsimshianTurkishU.S. Virgin IslanderUgandanUkrainianUruguayanUteVenezuelanVietnameseWelshWest IndianYakamaYaquiYugoslavianYumanYup'ikZimbabwean
Immigration
NonimmigrantsImmigrantsAfghanistanAfricaAlbaniaArgentinaArmeniaAsiaAustraliaAustriaBahamasBangladeshBarbadosBelarusBelgiumBelizeBoliviaBosnia and HerzegovinaBrazilBulgariaBurma/MyanmarCabo VerdeCambodiaCameroonCanadaCaribbeanCentral AmericaChileChinaColombiaCongoCosta RicaCroatiaCubaCzechoslovakiaDenmarkDominicaEastern AfricaEastern AsiaEastern EuropeEcuadorEgyptEl SalvadorEnglandEritreaEthiopiaEuropeFijiFranceGermanyGhanaGreeceGrenadaGuatemalaGuyanaHaitiHondurasHong KongHungaryIndiaIndonesiaIranIraqIrelandIsraelItalyJamaicaJapanJordanKazakhstanKenyaKoreaKuwaitLaosLatin AmericaLatviaLebanonLiberiaLithuaniaMalaysiaMexicoMicronesiaMiddle AfricaMoldovaMoroccoNepalNetherlandsNicaraguaNigeriaNorth AmericaNorth MacedoniaNorthern AfricaNorthern EuropeNorwayOceaniaPakistanPanamaPeruPhilippinesPolandPortugalRomaniaRussiaSaudi ArabiaScotlandSenegalSerbiaSierra LeoneSingaporeSomaliaSouth AfricaSouth AmericaSouth Central AsiaSouth Eastern AsiaSouthern EuropeSpainSri LankaSt. Vincent and the GrenadinesSudanSwedenSwitzerlandSyriaTaiwanThailandTrinidad and TobagoTurkeyUgandaUkraineUruguayUzbekistanVenezuelaVietnamWest IndiesWestern AfricaWestern AsiaWestern EuropeYemenZaireZimbabweAzores
Unemployment Among Ages 16 to 19 years
Income
Poverty
Unemployment
Labor Participation
Family Structure
Vehicle Availability
Education Level
Disability

Unemployment Among Ages 16 to 19 years Comparison

Immigrants from Dominican Republic

Potawatomi

Tragic
Excellent
23.3%
UNEMPLOYMENT AMONG AGES 16 TO 19 YEARS
0.0/ 100
METRIC RATING
328th/ 347
METRIC RANK
17.2%
UNEMPLOYMENT AMONG AGES 16 TO 19 YEARS
83.8/ 100
METRIC RATING
134th/ 347
METRIC RANK

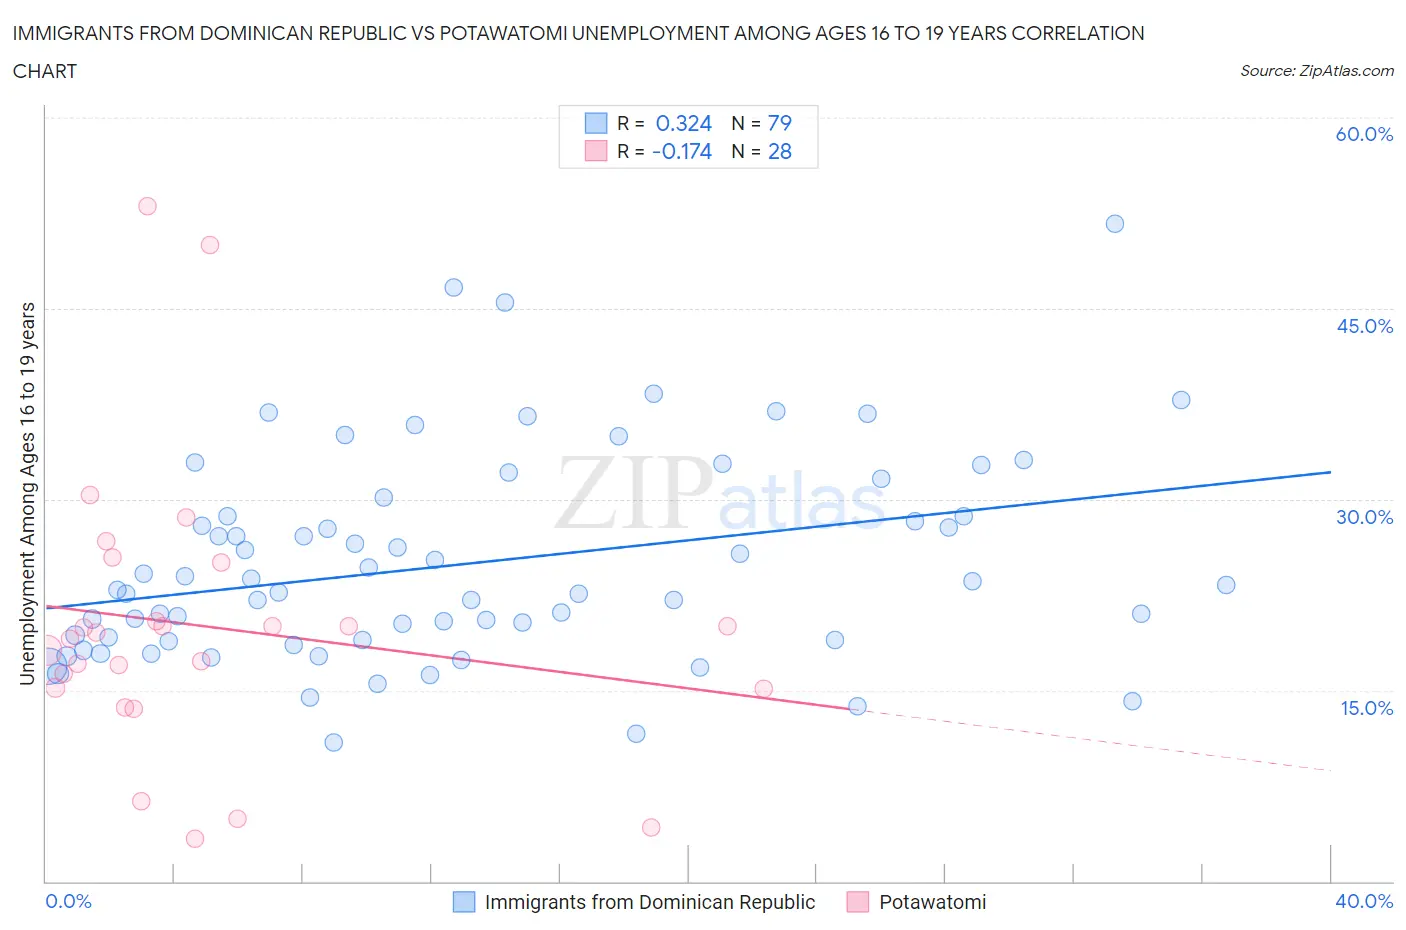
Immigrants from Dominican Republic vs Potawatomi Unemployment Among Ages 16 to 19 years Correlation Chart

The statistical analysis conducted on geographies consisting of 263,508,532 people shows a mild positive correlation between the proportion of Immigrants from Dominican Republic and unemployment rate among population between the ages 16 and 19 in the United States with a correlation coefficient (R) of 0.324 and weighted average of 23.3%. Similarly, the statistical analysis conducted on geographies consisting of 115,584,812 people shows a poor negative correlation between the proportion of Potawatomi and unemployment rate among population between the ages 16 and 19 in the United States with a correlation coefficient (R) of -0.174 and weighted average of 17.2%, a difference of 35.2%.
Immigrants from Dominican Republic vs Potawatomi Unemployment Among Ages 16 to 19 years

Unemployment Among Ages 16 to 19 years Correlation Summary

MeasurementImmigrants from Dominican RepublicPotawatomi
Minimum10.9%3.3%
Maximum51.7%53.0%
Range40.8%49.7%
Mean24.9%20.0%
Median22.9%19.3%
Interquartile 25% (IQ1)18.9%15.1%
Interquartile 75% (IQ3)28.7%22.7%
Interquartile Range (IQR)9.8%7.6%
Standard Deviation (Sample)8.2%11.2%
Standard Deviation (Population)8.1%11.0%

Similar Demographics by Unemployment Among Ages 16 to 19 years

Demographics Similar to Immigrants from Dominican Republic by Unemployment Among Ages 16 to 19 years

In terms of unemployment among ages 16 to 19 years, the demographic groups most similar to Immigrants from Dominican Republic are Pima (23.1%, a difference of 0.66%), Immigrants from Trinidad and Tobago (23.1%, a difference of 0.93%), Tlingit-Haida (23.5%, a difference of 1.1%), Dominican (23.6%, a difference of 1.5%), and British West Indian (24.0%, a difference of 2.9%).
DemographicsRating | RankUnemployment Among Ages 16 to 19 years
West Indians
0.0
/100
|
#321
Tragic
22.4%
Barbadians
0.0
/100
|
#322
Tragic
22.5%
Yakama
0.0
/100
|
#323
Tragic
22.5%
Immigrants | Armenia
0.0
/100
|
#324
Tragic
22.6%
Trinidadians and Tobagonians
0.0
/100
|
#325
Tragic
22.6%
Immigrants | Trinidad and Tobago
0.0
/100
|
#326
Tragic
23.1%
Pima
0.0
/100
|
#327
Tragic
23.1%
Immigrants | Dominican Republic
0.0
/100
|
#328
Tragic
23.3%
Tlingit-Haida
0.0
/100
|
#329
Tragic
23.5%
Dominicans
0.0
/100
|
#330
Tragic
23.6%
British West Indians
0.0
/100
|
#331
Tragic
24.0%
Immigrants | Barbados
0.0
/100
|
#332
Tragic
24.0%
Paiute
0.0
/100
|
#333
Tragic
24.4%
Guyanese
0.0
/100
|
#334
Tragic
24.8%
Arapaho
0.0
/100
|
#335
Tragic
25.2%

Demographics Similar to Potawatomi by Unemployment Among Ages 16 to 19 years

In terms of unemployment among ages 16 to 19 years, the demographic groups most similar to Potawatomi are Samoan (17.2%, a difference of 0.0%), Arab (17.2%, a difference of 0.010%), Laotian (17.2%, a difference of 0.010%), German Russian (17.2%, a difference of 0.030%), and Immigrants from Oceania (17.2%, a difference of 0.060%).
DemographicsRating | RankUnemployment Among Ages 16 to 19 years
Pakistanis
85.8
/100
|
#127
Excellent
17.2%
Australians
85.6
/100
|
#128
Excellent
17.2%
Creek
85.5
/100
|
#129
Excellent
17.2%
Immigrants | Indonesia
84.7
/100
|
#130
Excellent
17.2%
German Russians
84.1
/100
|
#131
Excellent
17.2%
Arabs
83.9
/100
|
#132
Excellent
17.2%
Laotians
83.9
/100
|
#133
Excellent
17.2%
Potawatomi
83.8
/100
|
#134
Excellent
17.2%
Samoans
83.7
/100
|
#135
Excellent
17.2%
Immigrants | Oceania
83.1
/100
|
#136
Excellent
17.2%
Immigrants | Malaysia
82.8
/100
|
#137
Excellent
17.2%
Bolivians
81.9
/100
|
#138
Excellent
17.3%
Immigrants | Eritrea
81.1
/100
|
#139
Excellent
17.3%
Immigrants | Croatia
80.8
/100
|
#140
Excellent
17.3%
Basques
80.7
/100
|
#141
Excellent
17.3%