Immigrants from Dominican Republic vs Immigrants from Korea Unemployment Among Ages 55 to 59 years
COMPARE
Immigrants from Dominican Republic
Immigrants from Korea
Unemployment Among Ages 55 to 59 years
Unemployment Among Ages 55 to 59 years Comparison
Immigrants from Dominican Republic
Immigrants from Korea
6.3%
UNEMPLOYMENT AMONG AGES 55 TO 59 YEARS
0.0/ 100
METRIC RATING
331st/ 347
METRIC RANK
4.5%
UNEMPLOYMENT AMONG AGES 55 TO 59 YEARS
99.8/ 100
METRIC RATING
43rd/ 347
METRIC RANK
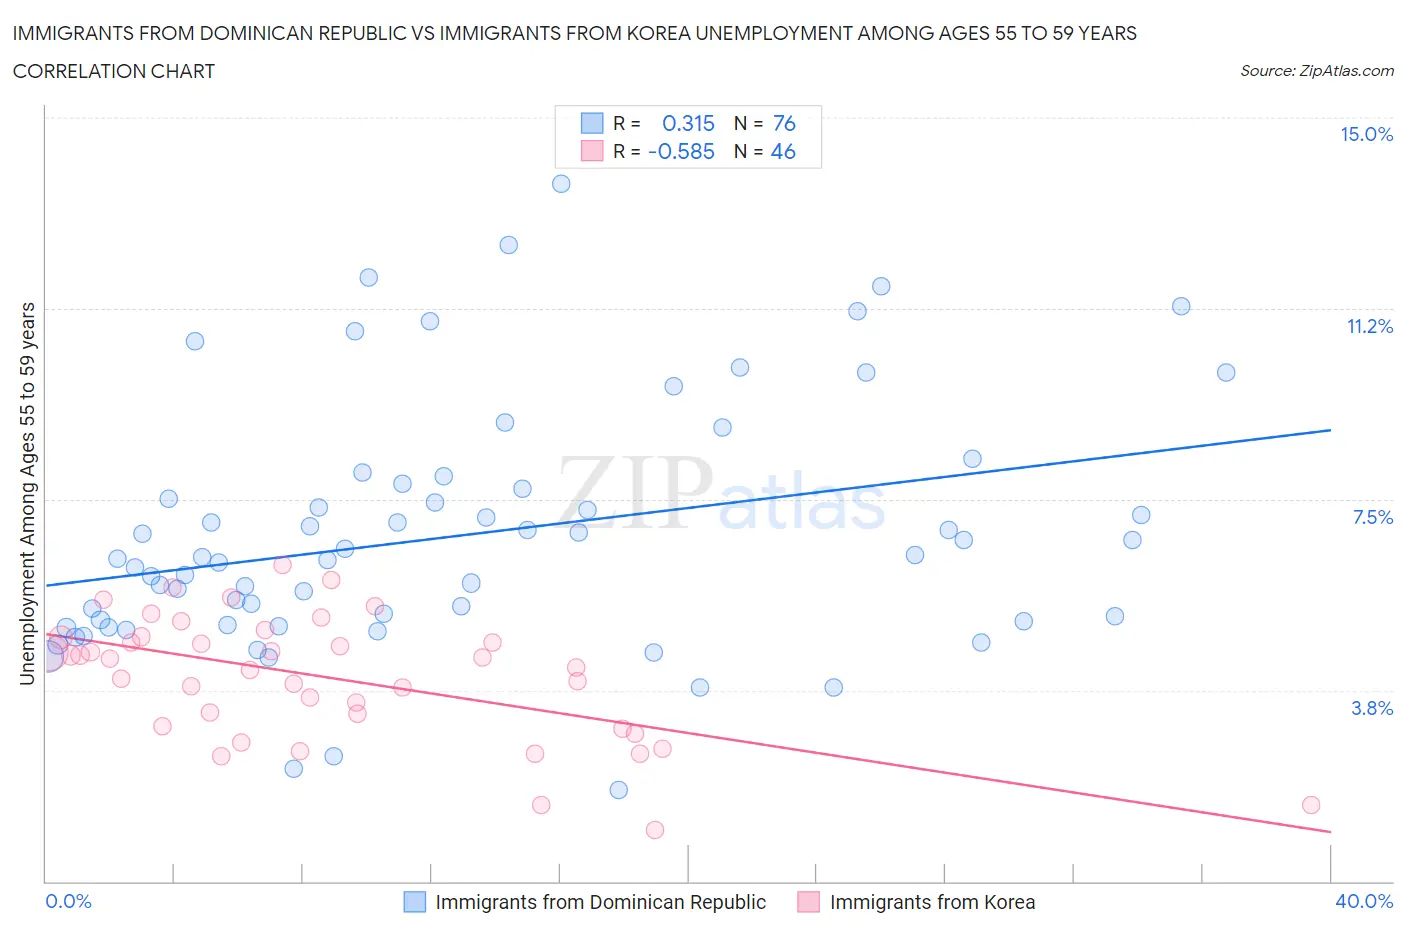
Immigrants from Dominican Republic vs Immigrants from Korea Unemployment Among Ages 55 to 59 years Correlation Chart
The statistical analysis conducted on geographies consisting of 261,117,923 people shows a mild positive correlation between the proportion of Immigrants from Dominican Republic and unemployment rate among population between the ages 55 and 59 in the United States with a correlation coefficient (R) of 0.315 and weighted average of 6.3%. Similarly, the statistical analysis conducted on geographies consisting of 385,536,412 people shows a substantial negative correlation between the proportion of Immigrants from Korea and unemployment rate among population between the ages 55 and 59 in the United States with a correlation coefficient (R) of -0.585 and weighted average of 4.5%, a difference of 39.3%.
Unemployment Among Ages 55 to 59 years Correlation Summary
| Measurement | Immigrants from Dominican Republic | Immigrants from Korea |
| Minimum | 1.8% | 1.0% |
| Maximum | 13.7% | 6.2% |
| Range | 11.9% | 5.2% |
| Mean | 6.8% | 4.0% |
| Median | 6.4% | 4.3% |
| Interquartile 25% (IQ1) | 5.1% | 3.1% |
| Interquartile 75% (IQ3) | 7.8% | 4.8% |
| Interquartile Range (IQR) | 2.7% | 1.7% |
| Standard Deviation (Sample) | 2.4% | 1.2% |
| Standard Deviation (Population) | 2.4% | 1.2% |
Similar Demographics by Unemployment Among Ages 55 to 59 years
Demographics Similar to Immigrants from Dominican Republic by Unemployment Among Ages 55 to 59 years
In terms of unemployment among ages 55 to 59 years, the demographic groups most similar to Immigrants from Dominican Republic are Alaska Native (6.2%, a difference of 0.68%), Dominican (6.2%, a difference of 1.1%), Aleut (6.4%, a difference of 2.4%), Yuman (6.1%, a difference of 2.6%), and Arapaho (6.1%, a difference of 3.8%).
| Demographics | Rating | Rank | Unemployment Among Ages 55 to 59 years |
| Vietnamese | 0.0 /100 | #324 | Tragic 5.9% |
| Immigrants | Armenia | 0.0 /100 | #325 | Tragic 6.0% |
| Natives/Alaskans | 0.0 /100 | #326 | Tragic 6.0% |
| Arapaho | 0.0 /100 | #327 | Tragic 6.1% |
| Yuman | 0.0 /100 | #328 | Tragic 6.1% |
| Dominicans | 0.0 /100 | #329 | Tragic 6.2% |
| Alaska Natives | 0.0 /100 | #330 | Tragic 6.2% |
| Immigrants | Dominican Republic | 0.0 /100 | #331 | Tragic 6.3% |
| Aleuts | 0.0 /100 | #332 | Tragic 6.4% |
| Pima | 0.0 /100 | #333 | Tragic 6.6% |
| Pueblo | 0.0 /100 | #334 | Tragic 6.7% |
| Colville | 0.0 /100 | #335 | Tragic 6.7% |
| Navajo | 0.0 /100 | #336 | Tragic 6.7% |
| Paiute | 0.0 /100 | #337 | Tragic 6.8% |
| Immigrants | Yemen | 0.0 /100 | #338 | Tragic 6.9% |
Demographics Similar to Immigrants from Korea by Unemployment Among Ages 55 to 59 years
In terms of unemployment among ages 55 to 59 years, the demographic groups most similar to Immigrants from Korea are European (4.5%, a difference of 0.0%), Immigrants from Kuwait (4.5%, a difference of 0.040%), Luxembourger (4.5%, a difference of 0.060%), Swiss (4.5%, a difference of 0.070%), and British (4.5%, a difference of 0.070%).
| Demographics | Rating | Rank | Unemployment Among Ages 55 to 59 years |
| Ethiopians | 99.9 /100 | #36 | Exceptional 4.5% |
| Immigrants | Bulgaria | 99.9 /100 | #37 | Exceptional 4.5% |
| Assyrians/Chaldeans/Syriacs | 99.9 /100 | #38 | Exceptional 4.5% |
| English | 99.9 /100 | #39 | Exceptional 4.5% |
| Swiss | 99.8 /100 | #40 | Exceptional 4.5% |
| Luxembourgers | 99.8 /100 | #41 | Exceptional 4.5% |
| Immigrants | Kuwait | 99.8 /100 | #42 | Exceptional 4.5% |
| Immigrants | Korea | 99.8 /100 | #43 | Exceptional 4.5% |
| Europeans | 99.8 /100 | #44 | Exceptional 4.5% |
| British | 99.8 /100 | #45 | Exceptional 4.5% |
| Immigrants | Zaire | 99.8 /100 | #46 | Exceptional 4.5% |
| German Russians | 99.8 /100 | #47 | Exceptional 4.5% |
| Immigrants | Moldova | 99.7 /100 | #48 | Exceptional 4.5% |
| Immigrants | Saudi Arabia | 99.7 /100 | #49 | Exceptional 4.5% |
| Immigrants | Pakistan | 99.7 /100 | #50 | Exceptional 4.5% |