Immigrants from Dominican Republic vs Immigrants from Colombia Unemployment
COMPARE
Immigrants from Dominican Republic
Immigrants from Colombia
Unemployment
Unemployment Comparison
Immigrants from Dominican Republic
Immigrants from Colombia
7.4%
UNEMPLOYMENT
0.0/ 100
METRIC RATING
333rd/ 347
METRIC RANK
5.2%
UNEMPLOYMENT
64.7/ 100
METRIC RATING
164th/ 347
METRIC RANK
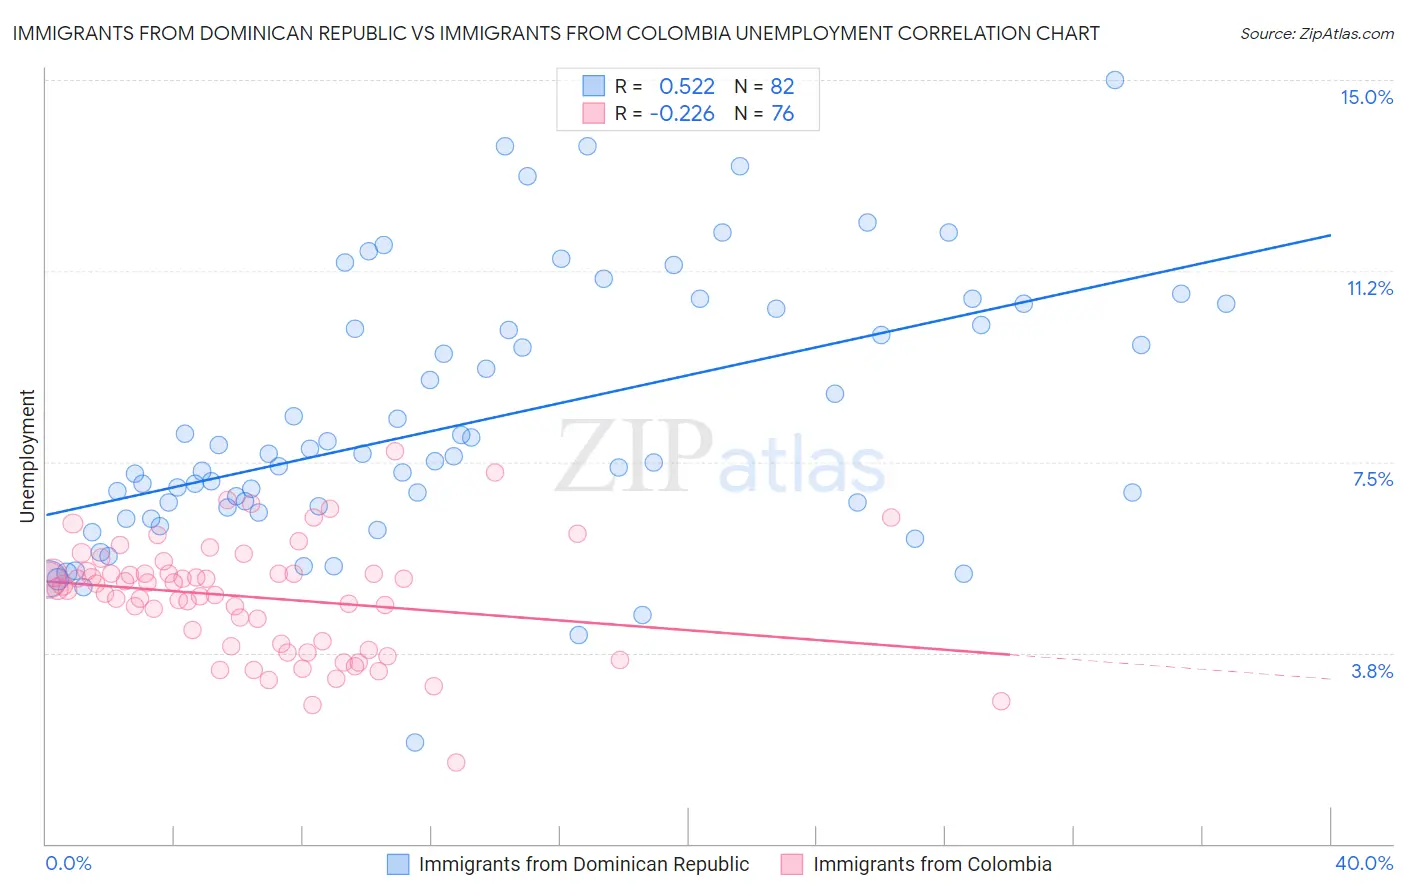
Immigrants from Dominican Republic vs Immigrants from Colombia Unemployment Correlation Chart
The statistical analysis conducted on geographies consisting of 274,892,404 people shows a substantial positive correlation between the proportion of Immigrants from Dominican Republic and unemployment in the United States with a correlation coefficient (R) of 0.522 and weighted average of 7.4%. Similarly, the statistical analysis conducted on geographies consisting of 378,436,728 people shows a weak negative correlation between the proportion of Immigrants from Colombia and unemployment in the United States with a correlation coefficient (R) of -0.226 and weighted average of 5.2%, a difference of 41.9%.
Unemployment Correlation Summary
| Measurement | Immigrants from Dominican Republic | Immigrants from Colombia |
| Minimum | 2.0% | 1.6% |
| Maximum | 15.0% | 7.7% |
| Range | 13.0% | 6.1% |
| Mean | 8.3% | 4.8% |
| Median | 7.6% | 5.0% |
| Interquartile 25% (IQ1) | 6.6% | 3.9% |
| Interquartile 75% (IQ3) | 10.2% | 5.3% |
| Interquartile Range (IQR) | 3.6% | 1.4% |
| Standard Deviation (Sample) | 2.6% | 1.1% |
| Standard Deviation (Population) | 2.5% | 1.1% |
Similar Demographics by Unemployment
Demographics Similar to Immigrants from Dominican Republic by Unemployment
In terms of unemployment, the demographic groups most similar to Immigrants from Dominican Republic are Sioux (7.4%, a difference of 0.060%), Apache (7.4%, a difference of 0.47%), Dominican (7.4%, a difference of 0.48%), Yakama (7.3%, a difference of 0.82%), and Alaska Native (7.2%, a difference of 2.1%).
| Demographics | Rating | Rank | Unemployment |
| Paiute | 0.0 /100 | #326 | Tragic 7.1% |
| Pueblo | 0.0 /100 | #327 | Tragic 7.2% |
| Tsimshian | 0.0 /100 | #328 | Tragic 7.2% |
| Alaska Natives | 0.0 /100 | #329 | Tragic 7.2% |
| Yakama | 0.0 /100 | #330 | Tragic 7.3% |
| Dominicans | 0.0 /100 | #331 | Tragic 7.4% |
| Sioux | 0.0 /100 | #332 | Tragic 7.4% |
| Immigrants | Dominican Republic | 0.0 /100 | #333 | Tragic 7.4% |
| Apache | 0.0 /100 | #334 | Tragic 7.4% |
| Alaskan Athabascans | 0.0 /100 | #335 | Tragic 7.7% |
| Immigrants | Yemen | 0.0 /100 | #336 | Tragic 7.7% |
| Cheyenne | 0.0 /100 | #337 | Tragic 8.0% |
| Pima | 0.0 /100 | #338 | Tragic 8.2% |
| Navajo | 0.0 /100 | #339 | Tragic 8.4% |
| Puerto Ricans | 0.0 /100 | #340 | Tragic 8.4% |
Demographics Similar to Immigrants from Colombia by Unemployment
In terms of unemployment, the demographic groups most similar to Immigrants from Colombia are Immigrants from Zaire (5.2%, a difference of 0.0%), Spanish (5.2%, a difference of 0.030%), Immigrants from Oceania (5.2%, a difference of 0.040%), Laotian (5.2%, a difference of 0.11%), and Immigrants from Brazil (5.2%, a difference of 0.11%).
| Demographics | Rating | Rank | Unemployment |
| Sri Lankans | 69.5 /100 | #157 | Good 5.2% |
| Immigrants | Egypt | 66.7 /100 | #158 | Good 5.2% |
| Immigrants | Russia | 66.6 /100 | #159 | Good 5.2% |
| Laotians | 66.3 /100 | #160 | Good 5.2% |
| Immigrants | Oceania | 65.2 /100 | #161 | Good 5.2% |
| Spanish | 65.1 /100 | #162 | Good 5.2% |
| Immigrants | Zaire | 64.7 /100 | #163 | Good 5.2% |
| Immigrants | Colombia | 64.7 /100 | #164 | Good 5.2% |
| Immigrants | Brazil | 63.1 /100 | #165 | Good 5.2% |
| Immigrants | Indonesia | 61.2 /100 | #166 | Good 5.2% |
| Colombians | 61.1 /100 | #167 | Good 5.2% |
| Uruguayans | 60.2 /100 | #168 | Good 5.2% |
| Immigrants | Morocco | 59.1 /100 | #169 | Average 5.2% |
| Immigrants | Nicaragua | 57.1 /100 | #170 | Average 5.2% |
| Puget Sound Salish | 56.6 /100 | #171 | Average 5.2% |