Immigrants from Denmark vs Yup'ik Female Unemployment
COMPARE
Immigrants from Denmark
Yup'ik
Female Unemployment
Female Unemployment Comparison
Immigrants from Denmark
Yup'ik
5.2%
FEMALE UNEMPLOYMENT
55.0/ 100
METRIC RATING
171st/ 347
METRIC RANK
10.9%
FEMALE UNEMPLOYMENT
0.0/ 100
METRIC RATING
346th/ 347
METRIC RANK
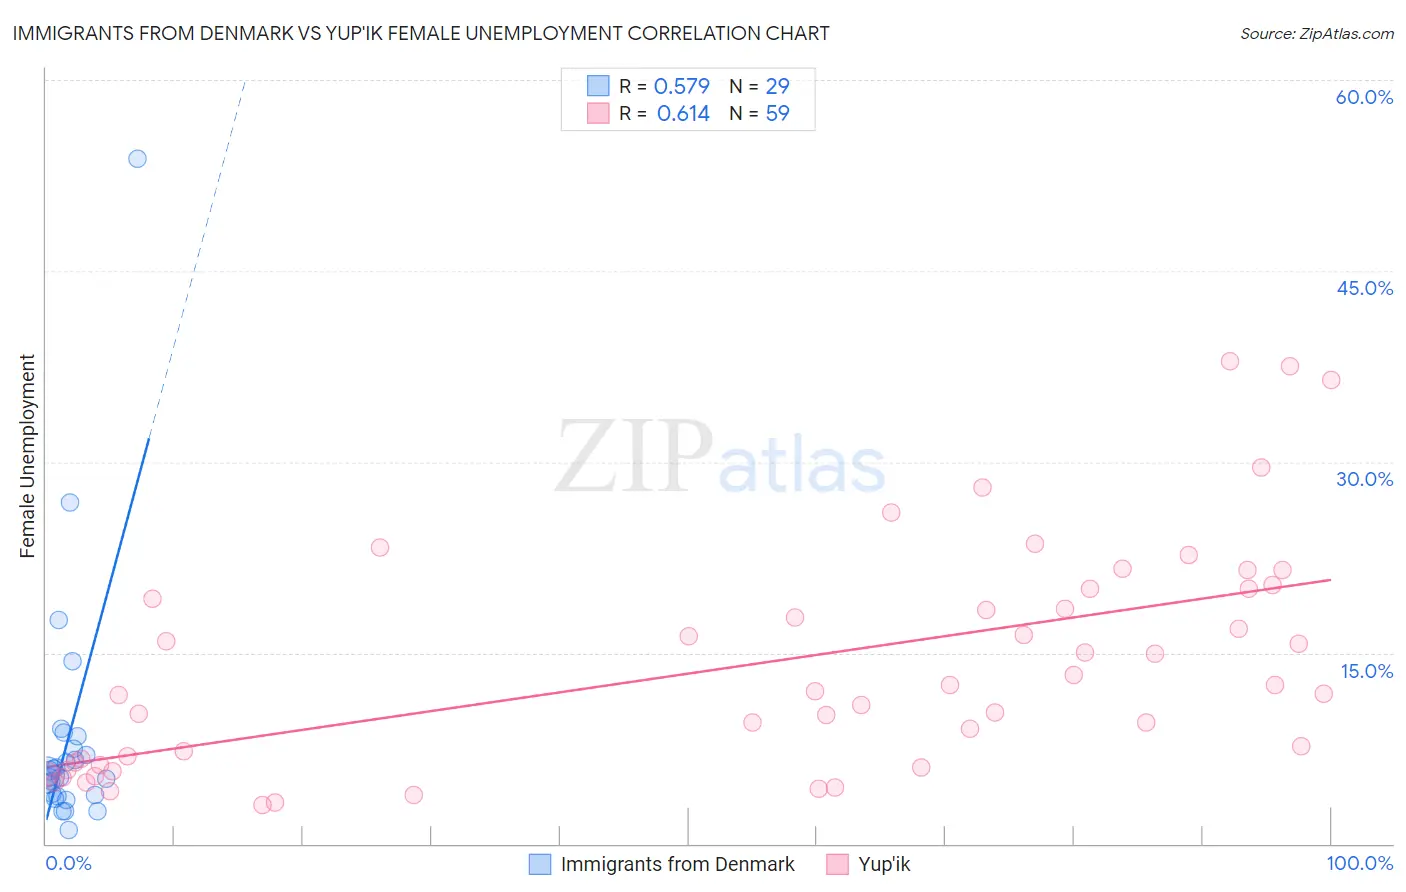
Immigrants from Denmark vs Yup'ik Female Unemployment Correlation Chart
The statistical analysis conducted on geographies consisting of 136,180,001 people shows a substantial positive correlation between the proportion of Immigrants from Denmark and unemploymnet rate among females in the United States with a correlation coefficient (R) of 0.579 and weighted average of 5.2%. Similarly, the statistical analysis conducted on geographies consisting of 39,915,126 people shows a significant positive correlation between the proportion of Yup'ik and unemploymnet rate among females in the United States with a correlation coefficient (R) of 0.614 and weighted average of 10.9%, a difference of 107.4%.
Female Unemployment Correlation Summary
| Measurement | Immigrants from Denmark | Yup'ik |
| Minimum | 1.1% | 3.0% |
| Maximum | 53.8% | 37.9% |
| Range | 52.7% | 34.9% |
| Mean | 8.3% | 14.0% |
| Median | 5.4% | 12.0% |
| Interquartile 25% (IQ1) | 3.8% | 6.2% |
| Interquartile 75% (IQ3) | 8.0% | 20.0% |
| Interquartile Range (IQR) | 4.2% | 13.8% |
| Standard Deviation (Sample) | 10.1% | 8.8% |
| Standard Deviation (Population) | 10.0% | 8.8% |
Similar Demographics by Female Unemployment
Demographics Similar to Immigrants from Denmark by Female Unemployment
In terms of female unemployment, the demographic groups most similar to Immigrants from Denmark are Spanish (5.2%, a difference of 0.050%), Immigrants from Chile (5.2%, a difference of 0.24%), Immigrants from Uganda (5.3%, a difference of 0.26%), Sri Lankan (5.2%, a difference of 0.27%), and Iranian (5.3%, a difference of 0.28%).
| Demographics | Rating | Rank | Female Unemployment |
| Bangladeshis | 64.3 /100 | #164 | Good 5.2% |
| Syrians | 62.8 /100 | #165 | Good 5.2% |
| Native Hawaiians | 62.7 /100 | #166 | Good 5.2% |
| Immigrants | Thailand | 62.1 /100 | #167 | Good 5.2% |
| Sri Lankans | 59.4 /100 | #168 | Average 5.2% |
| Immigrants | Chile | 59.0 /100 | #169 | Average 5.2% |
| Spanish | 55.9 /100 | #170 | Average 5.2% |
| Immigrants | Denmark | 55.0 /100 | #171 | Average 5.2% |
| Immigrants | Uganda | 50.7 /100 | #172 | Average 5.3% |
| Iranians | 50.4 /100 | #173 | Average 5.3% |
| Immigrants | Poland | 50.0 /100 | #174 | Average 5.3% |
| Immigrants | Laos | 47.5 /100 | #175 | Average 5.3% |
| Immigrants | Vietnam | 47.5 /100 | #176 | Average 5.3% |
| Immigrants | Morocco | 47.4 /100 | #177 | Average 5.3% |
| Immigrants | Southern Europe | 46.2 /100 | #178 | Average 5.3% |
Demographics Similar to Yup'ik by Female Unemployment
In terms of female unemployment, the demographic groups most similar to Yup'ik are Crow (12.1%, a difference of 11.5%), Yuman (9.6%, a difference of 13.4%), Pima (9.3%, a difference of 16.5%), Arapaho (8.8%, a difference of 23.7%), and Puerto Rican (8.3%, a difference of 30.4%).
| Demographics | Rating | Rank | Female Unemployment |
| Menominee | 0.0 /100 | #333 | Tragic 7.0% |
| Immigrants | Armenia | 0.0 /100 | #334 | Tragic 7.1% |
| Dominicans | 0.0 /100 | #335 | Tragic 7.2% |
| Immigrants | Dominican Republic | 0.0 /100 | #336 | Tragic 7.2% |
| Navajo | 0.0 /100 | #337 | Tragic 7.3% |
| Tohono O'odham | 0.0 /100 | #338 | Tragic 7.7% |
| Immigrants | Yemen | 0.0 /100 | #339 | Tragic 7.8% |
| Hopi | 0.0 /100 | #340 | Tragic 8.1% |
| Inupiat | 0.0 /100 | #341 | Tragic 8.2% |
| Puerto Ricans | 0.0 /100 | #342 | Tragic 8.3% |
| Arapaho | 0.0 /100 | #343 | Tragic 8.8% |
| Pima | 0.0 /100 | #344 | Tragic 9.3% |
| Yuman | 0.0 /100 | #345 | Tragic 9.6% |
| Yup'ik | 0.0 /100 | #346 | Tragic 10.9% |
| Crow | 0.0 /100 | #347 | Tragic 12.1% |